By ATGL
Updated November 26, 2025
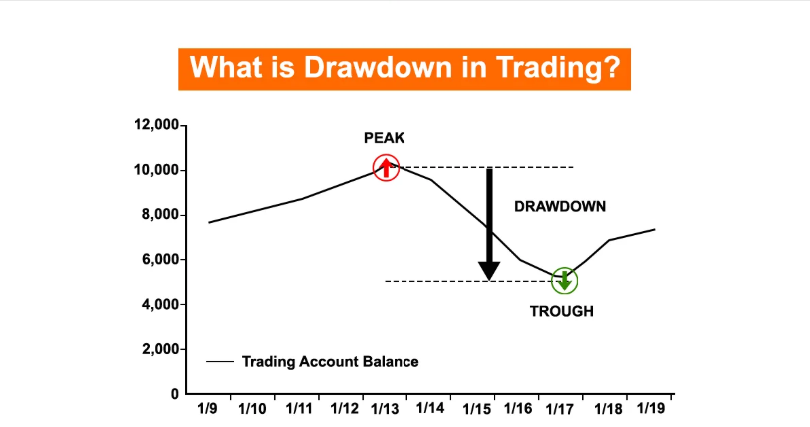
Drawdown is one of the most critical metrics in trading for assessing performance and managing risk exposure. It quantifies the decline of an investment portfolio from a peak to a trough before a new peak is reached. For investors and traders seeking a systematic, unemotional approach to markets—an approach emphasized at Above the Green Line—understanding drawdown is essential to long-term success and capital preservation.
While total return and volatility are commonly discussed, drawdown offers a clearer picture of downside exposure. It reveals the depth and duration of capital loss, helping traders set better expectations, compare strategies, and improve emotional discipline during inevitable downturns. Whether operating across equities, fixed income, or other asset classes, this metric enables consistent evaluation of investment performance under varying conditions.
What Is Drawdown in Trading and Why Does It Matter?
In trading, drawdown refers to the reduction in equity from a portfolio’s highest point to its lowest point over a given period. It is typically expressed as a percentage, representing the degree of decline from the most recent peak. If an account grows to $100,000, then drops to $80,000, the drawdown is 20%.
This metric matters because it highlights potential losses before recovery occurs. Many traders only focus on gains, but a strategy that produces high returns with large drawdowns may not be sustainable. Drawdown measures investment risk, not just reward, offering a more balanced view of performance.
Understanding drawdown also assists with preserving capital. A 50% drawdown requires a 100% return to break even, while a 20% drawdown needs just a 25% gain for recovery. Therefore, minimizing drawdowns can significantly improve portfolio efficiency and psychological resilience.
Drawdowns also serve as key benchmarks when evaluating trading strategy performance. Whether you are implementing trend-following systems or mean-reversion models, incorporating drawdown analysis provides a reliable framework for determining whether a strategy aligns with your investment objectives.
For those pursuing systematic approaches such as those used in our capital growth management strategies, drawdown serves as a core diagnostic tool to evaluate the consistency and risk profile of a method.
How To Calculate Drawdown (and What It Reveals)
Calculating drawdown involves tracking a portfolio’s equity over time and measuring the decline from the peak to the subsequent low before a new peak is achieved. The formula is straightforward:
Drawdown (%) = (Peak Equity – Trough Equity) / Peak Equity × 100
For example, if your account grows to $120,000 and later drops to $102,000, your drawdown is:
(120,000 – 102,000) / 120,000 × 100 = 15%
This calculation can be applied to individual trades, strategies, or entire portfolios.
There are different types of drawdowns:
- Absolute drawdown measures the decline from the initial investment value to the lowest point.
- Relative drawdown evaluates the percentage drop from the highest equity level to the lowest.
Analyzing drawdowns on an equity curve provides insights into strategy stability. A smoother curve with shallow and short-lived drawdowns often reflects a lower-risk, more consistent system, whereas a volatile curve with deep declines may indicate excessive leverage or inconsistent execution. The use of stock charts in investing allows investors to evaluate price action over time and recognize recurring technical patterns.
When examining average drawdown over time, traders can assess the general risk tolerance of their approach by averaging multiple drawdown events. This is particularly useful in volatile environments, where single extreme values may distort overall risk assessments.
Maximum Drawdown and What It Says About Risk
Maximum drawdown (MDD) is the largest observed loss from a peak to a trough in a portfolio, strategy, or trading account. It represents the worst-case historical drawdown scenario and is a critical metric for comparing strategies and assessing whether the potential losses align with your risk tolerance.
If one strategy shows a maximum drawdown of 12%, and another shows 35%, the former may be more suitable for risk-averse traders—even if the latter had higher average returns. This is because deeper drawdowns can impair performance over time, delay recovery, and trigger emotional responses that lead to poor decision-making.
Maximum drawdown should not be analyzed in isolation. It complements other metrics like the risk-reward ratio and volatility measures. Evaluating performance through a multi-metric lens provides a more accurate picture of a strategy’s true efficiency.
Drawdowns also need to be viewed in the context of broader market cycles. During expansion phases, drawdowns tend to be smaller and recoveries faster. However, in contractionary or uncertain periods, strategies with a history of controlling drawdowns offer greater long-term resilience.
Drawdown in Forex Trading and Other Volatile Markets
Drawdown in Forex trading is often more pronounced due to the use of leverage. In Forex, traders commonly use margin accounts that allow positions many times larger than their capital. While this increases potential returns, it also magnifies losses.
For instance, with 50:1 leverage, a 2% adverse move can wipe out a significant portion of the account balance. This is why risk-conscious Forex traders focus heavily on position sizing, stop-loss placement, and disciplined risk management protocols.
The concept of drawdown in Forex trading applies the same peak-to-trough logic but occurs in faster, often more volatile cycles. Therefore, setting appropriate leverage limits, using trailing stops, and monitoring equity curves closely become essential components of managing risk.
Traders should also be attuned to ongoing market news, which can act as a catalyst for sharp currency movements. Ignoring major economic releases or geopolitical developments can expose a trader to unexpected spikes in market volatility, resulting in deeper and longer-lasting drawdowns.
ATGL’s approach to technical analysis and disciplined trading execution can help traders better navigate the volatility inherent in leveraged markets.
What Is a Good Drawdown? Practical Ranges and Recovery Principles
There is no universal benchmark for a “good” drawdown, but general guidelines can help set expectations:
- Low drawdown (0%–10%): Indicates high capital preservation. Ideal for conservative strategies and investors seeking stability over high returns.
- Moderate drawdown (10%–20%): Acceptable for active strategies, especially those with strong historical recovery rates.
- High drawdown (20%+): Often seen in aggressive strategies. Requires higher returns to recover and greater emotional resilience.
What truly matters is whether the drawdown is manageable given your financial goals, risk tolerance, and time horizon. For example, a 15% drawdown in a strategy with a consistent 25% annual return and short recovery time may be entirely acceptable.
Recovery principles are equally important. Losses grow geometrically as they deepen. A 10% drawdown needs an 11.1% gain to recover; a 40% drawdown requires a 66.7% gain. This asymmetry underscores the importance of limiting drawdowns to preserve long-term compounding.
Risk-reduction techniques such as position sizing, stop-loss orders, diversification, and adhering to a rules-based system help mitigate excessive drawdowns. Additionally, using tools like stock charts to track technical patterns and support/resistance levels can prevent premature or emotional exits.
Asset allocation also plays a role in minimizing drawdown exposure. Diversifying across asset classes—equities, bonds, commodities, or Forex—can reduce correlation and smooth returns during turbulent market conditions. Well-designed investment strategies that include proper diversification will likely experience lower drawdowns over time.
By incorporating drawdown analysis into a broader strategy—alongside measures like maximum loss limits and position management from stock trading principles—investors can improve both discipline and long-term returns.
Understanding drawdown is essential to maintaining emotional control, managing risk, and supporting sustainable growth. Whether you are navigating volatile Forex markets or applying a long-term equity strategy, minimizing drawdown enhances capital efficiency and trading confidence.
Above the Green Line’s membership options provide traders with systematic tools designed to optimize returns while managing downside exposure. Learn more about our proprietary approach to disciplined investing through our membership plans.


