
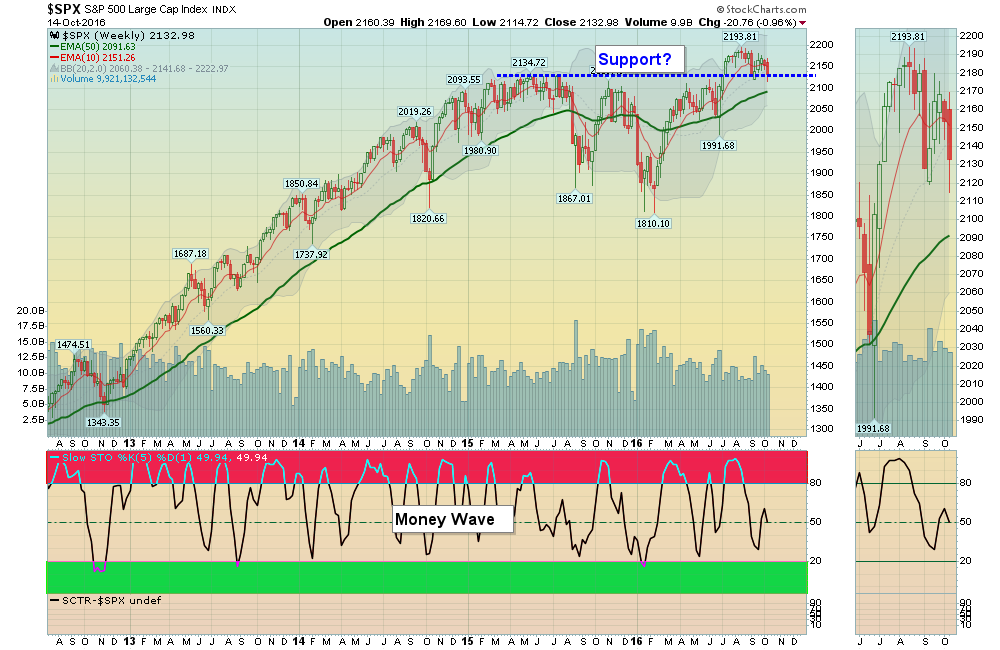
S&P 500 is trying to hold above Support!
10/16/2016: Markets were down for the week as the S&P 500 struggled to hold above Support around 2119. Markets are no longer benefitting from Low Interest Rates and Oil Prices. The S&P 500 Closing below 2119 could be Bearish!
Short Term we are finally getting more Investments in the Green Zones besides the Gold Miners.
The Strongest Leaders below have corrected down near their Red Lines (50-day avgs.) and should go back up and re-test their Highs.
Average Investments that are currently Below the Green Line, and have not made Highs recently, Should BE SOLD soon.
Money Wave Buy on Friday for WPX.
Money Waves Buys soon for NTAP ADSK AMAT AMKR ARIA HPE OCLR SMH SRPT TTMI YELP.
We will email you when they are ready. Watch List
Current Open Positions Closed Positions Charts for Leaders
Alert! Market Risk Medium (Yellow Zone). The probability of successful Short Term Trades is lower, when the S&P 500 is Way Above the Green Line. Even the Strongest Funds can get chopped up. Either take quick gains from Money Wave Pops, or STAY IN CASH & WAIT for a larger correction.
QUESTIONS: Carl W. writes
“I would be very interested in your service if you included stocks that were below the green line, below 10 (or 20) RS, and Money Wave above 80. I suspect that we will be entering a difficult market period where shorting will be more profitable. ”
ANSWER:
Thank you Carl. Most Investors do not and probably will not ever understand Shorting or Selling Short.
When the Markets go into Bear, we will use the same Rules and rotate into Inverse Funds (like we did in 2008).
Performance in a Bear Market using Inverse Funds can be Exceptional!
Good trading, and tell your friends!


