Top Pick of the Week (TPOW) – Weekly Review
This ATGL Top Pick of the Week (TPOW) review covers a two-week educational model trade in ADTN — ADTRAN Holdings, Inc. (Nasdaq: ADTN), a global provider of broadband access and optical networking platforms. The trade was opened on Monday, May 11, 2026 at the market open price of $15.91. Under the standard ATGL educational framework, the position would normally be reviewed for exit at the Friday, May 15 close at the end of week 1. ADTN closed week 1 at approximately $14.96 — below the entry price, but still above the defined stop level of $14.10, with the green line intact and relative strength measures holding. Based on these technical characteristics remaining constructive, the position was carried into a second week. The model target of $17.50 was not reached in week 2 either, and the position was exited at the Friday, May 22 close at $15.67. The result was a loss of $0.24 per share, or -1.51% over the full eight-day holding period.
Trade Summary
| Open Date | Open Price | Close Date | Close Price | Exit Reason |
| May 11, 2026 | $15.91 | May 22, 2026 | $15.67 | Friday close — week 2 |
| Gain / Share | Return % | Days Held | Outcome | Target % |
| -$0.24 | -1.51% | 8 | Loss | 4.00% |
Week 1 note: ADTN closed Friday May 15, 2026 at approximately $14.96 — below entry but above the $14.10 stop. The green line and SCTR remained intact. Position carried into week 2 based on key technical levels holding. Exit at Friday May 22 close after target remained out of reach in week 2.
SPY Performance — Full Holding Period (May 11 – May 22, 2026)
| SPY Open (5/11) | SPY Close (5/22) | Period Change | Direction |
| ~$744.00 | $745.64 | +0.22% | Up (flat) |
SPY was effectively flat over the full two-week holding period, opening around $744 on May 11 and closing at $745.64 on May 22 for an approximate gain of +0.22%. This net result masked a volatile round trip — SPY hit a new 52-week high of $749.53 on May 14 before retreating on Treasury yield pressure and geopolitical concerns during the week of May 19, then recovering strongly into the May 22 close on the Nvidia earnings catalyst and U.S.-Iran peace signals. ADTN returned -1.51% over the same period, underperforming SPY.
Trade Breakdown
ADTRAN Holdings, Inc. (ADTN) was selected as the ATGL TPOW beginning May 11, 2026 on the basis of a strong technical profile. At selection, ADTN carried a SCTR ranking of 93.8 — confirming significant relative technical strength versus the broader market. The stock was positioned above the green line, a key signal in the ATGL educational methodology indicating sustained trend health and institutional participation. The daily chart showed a constructive pattern of bullish stochastic divergence with the Slow Stochastic making higher lows while price held support — a configuration the ATGL educational model identifies as characteristic of quality setup candidates.
The educational model trade opened at the market open on Monday, May 11, 2026 at $15.91 with a defined model target of $17.50 — approximately a 10% move from entry — and a stop level below $14.10. The first week proved challenging as broader market conditions shifted: the 10-year Treasury yield climbed to its highest level in over a year, risk sentiment deteriorated around ongoing U.S.-Iran tensions, and ADTN encountered selling pressure. By the close of Friday, May 15 ADTN was at approximately $14.96 — a pullback of roughly $0.95 from entry.
Importantly, the $14.10 stop had not been triggered, the green line remained intact and rising, and the SCTR continued to reflect above-average relative strength. With the stock maintaining these technical characteristics, the position was carried into a second week rather than exited at the standard Friday close. In week 2, ADTN stabilized and recovered partially, closing Friday May 22 at $15.67. With the $17.50 target still not reached and a second consecutive Friday close approaching, the position was exited at $15.67 per the Friday close discipline — resulting in a final loss of $0.24 per share, or -1.51% over the full eight-day hold.
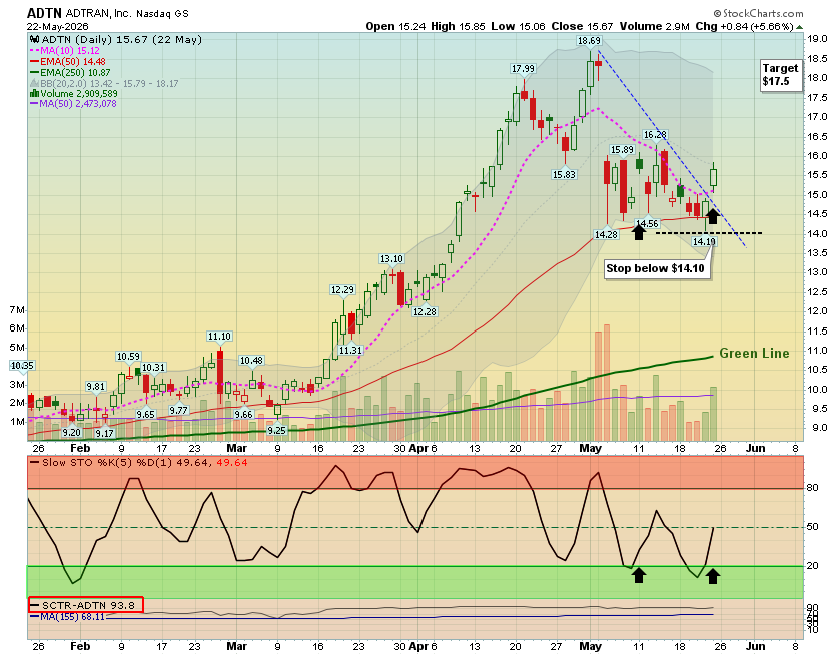
ADTN — Daily chart showing entry at $15.91 (May 11), week 1 close at ~$14.96 (May 15), model target at $17.50, stop below $14.10, and final exit at $15.67 (May 22, 2026). SCTR: 93.8. Two-week holding period.
Market Conditions
The two-week period from May 11 through May 22, 2026 was characterized by elevated volatility and a meaningful intra-period reversal in market sentiment. The first week opened with markets near all-time highs — SPY hit $749.53 on May 14 — before sentiment shifted as the 10-year Treasury yield climbed to its highest level in over a year, reigniting inflation concerns. Bank of America analysts publicly suggested the Federal Reserve may delay rate cuts until the second half of 2027. The ongoing U.S.-Iran conflict added geopolitical risk premium, with oil prices elevated and consumer confidence data showing signs of pressure. These conditions weighed on ADTN and the broader Communication Equipment sector during week 1.
The second week brought a meaningful reversal. Nvidia reported strong quarterly earnings on Wednesday, May 20, reinforcing the AI infrastructure investment thesis and catalyzing broad market recovery. Renewed — if tentative — signals of progress on U.S.-Iran peace talks eased oil-related concerns. Incoming Federal Reserve Chair Kevin Warsh took office on Friday, May 22 in an orderly transition. SPY closed the second week at $745.64, marking its eighth consecutive positive week — the longest winning streak since 2023. Despite the improving backdrop, ADTN and Communication Equipment names did not participate strongly in the tech-led recovery, as the sector lacked the direct AI narrative catalyst driving semiconductor and hyperscaler outperformance.
SPY Performance — Two-Week Context
Over the full holding period of this TPOW trade, SPY moved from approximately $744 on the morning of May 11 to $745.64 at the close of May 22 — a net gain of approximately +0.22%. The net figure understates the period’s volatility: SPY reached a new 52-week high of $749.53 on May 14 before retreating to around the $733 area by May 19 — approximately a 2.2% peak-to-trough drawdown — before recovering strongly into the May 22 close. The second week alone saw SPY gain approximately +1.72% from the May 19 open to the May 22 close.
SPY’s key technical levels remained constructive throughout the period. The $733 area held as support during the May 19 test, resistance near the $749 52-week high was not retested by May 22, and the VIX closed the period at 16.70 — reflecting a contained volatility environment. All three primary moving averages on SPY continued to trend higher, and the eight-week winning streak signals sustained underlying demand. ADTN’s -1.51% result over the same period underperformed SPY’s marginal gain, illustrating how sector-specific dynamics can diverge from broad market strength.
Strategy Insight
This ADTN trade provides two distinct educational observations. The first concerns the standard Friday close exit rule. The ATGL educational methodology uses a defined weekly holding window with Friday close as the exit discipline — this removes emotion from the decision, enforces consistency, and ensures capital is recycled into the next educational setup. The rule exists precisely because holding losing positions in hope of recovery is one of the most common ways undisciplined trading erodes long-term results.
The second observation concerns the hold decision at the end of week 1. When ADTN closed May 15 at approximately $14.96 — below entry but above the $14.10 stop, with the green line and SCTR intact — there was a considered judgement that the technical structure of the trade had not been invalidated. This type of discretionary carry is not a standard rule in the ATGL educational model; it reflects an informed assessment that key support levels held. The outcome — a loss in week 2 as well — is itself an important educational data point: extending a hold into a second week did not improve the result, and the final loss was comparable to what a week 1 exit would have produced. This reinforces the discipline inherent in the Friday close rule. The stop at $14.10 was respected throughout both weeks, demonstrating that while the trade did not produce a gain, the risk framework performed as designed.
Conclusion
This two-week TPOW educational model trade in ADTRAN Holdings, Inc. (ADTN) resulted in a -1.51% loss, with the position opened May 11 at $15.91, carried through the May 15 close as key technical levels held, and exited at the May 22 Friday close at $15.67. The $17.50 model target was not reached in either week. The stop at $14.10 was never triggered. Looking ahead, ADTN retains a strong SCTR of 93.8, the green line continues to rise, and the stochastic divergence pattern on the daily chart remains constructive — the stock continues to meet the ATGL educational selection framework characteristics. Broader markets head into the Memorial Day holiday weekend with SPY on an eight-week winning streak, attention turning to the new Fed Chair Warsh’s first public communications and any developments in U.S.-Iran negotiations.
The Top Pick of the Week (TPOW) is part of the rules-based investing framework used at Above the Green Line. To explore the full methodology and other proven educational strategies, visit our Investment Strategy Guide.