By ATGL
Updated March 13, 2026
For income investors, dividends are a source of steady cash flow and potential long-term growth. Beyond the immediate financial benefit, the rate at which these dividends increase over time—known as the dividend growth rate—is a crucial factor in building wealth and assessing the health of an investment.
Dividend growth is also a foundational component of many dividend valuation frameworks used by long-term investors. Those interested in understanding how dividend growth rates, payout ratios, and valuation models work together can explore the Dividend Growth Guide, which explains the principles behind dividend growth investing and dividend-based stock valuation.
A key part of building long-term wealth relies on understanding the role that dividend growth rate plays. It’s not just about the money you’ll earn right now, but also about the various other benefits it brings. Dividends lead to income stream growth that can be significant over time, especially when combined with compounding dividends or reinvesting the money you earned in dividends back into shares of the company.
Dividend growth also serves as an effective hedge against inflation, ensuring the value of your money doesn’t erode over time. An investment strategy based on dividend growth can also serve as a risk mitigation tool because stocks that pay consistently greater dividends tend to be less volatile.
The stability and quality of companies that consistently grow dividends often manifest in consistent long-term returns, which contributes to your total returns.
What Is the Dividend Growth Rate?
The dividend growth rate is a percentage representation of how much a company’s dividend payments have increased over a period of time. It’s an important metric for investors looking for companies with the potential for future dividend growth and an increase in stock price appreciation.
Long-standing firms with a robust track record of dividend payments — like many of the Standard & Poor’s 500 — often aim to maintain or increase their annual dividend payout to shareholders.
In fact, the S&P 500 Dividend Aristocrats Index lists exactly these kinds of companies. This list serves as an exclusive roster of publicly traded companies that have increased dividend payments for over 25 years.
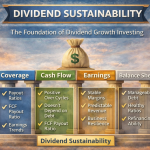
This consistency can signal confidence in the company’s future cash flow and overall financial health. Understanding how quickly dividends have grown can provide insight into the company’s management, stability, and ability to weather economic fluctuations.
What Is the Mathematical Formula for Dividend Growth Rates?
Calculating the dividend growth rate can be done with the following formula:
Dividend Growth Rate = [(Current Year’s Dividend per Share – Previous Year’s Dividend per Share) / Previous Year’s Dividend per Share] x 100
This formula isn’t just for an annual dividend growth rate. It can apply to any period of time, whether you’re looking at a year-over-year comparison or a longer span. On an annual basis, you’d replace the “Current Year’s Dividend per Share” and “Previous Year’s Dividend per Share” with the respective dividend amounts for the periods of time you’re interested in analyzing.
How Are Dividend Yield and Dividend Growth Different?
Dividend yield is the ratio of a company’s annual dividend compared to its current stock price, usually expressed as a percentage. While the yield offers insights into the income you can expect over time relative to the price per common share, it doesn’t provide information about how dividends may have changed over time or predict future dividends. The dividend growth rate, on the other hand, directly measures the rate of dividend growth, indicating a trend and the possibility of future increase.
The Dividend Discount Model and Long-Term Profitability
One application of the dividend growth rate is in the Dividend Discount Model (DDM), also known as the Gordon Growth Model. This is a method used to estimate the current fair value of a stock by projecting future dividends.
The formula takes into account the expected future dividends, the cost of equity (the rate of return required by an investor for investing in a company), and the expected dividend growth rate.
Put another way, the DDM formula can be expressed as:
Current Stock Price = (Annualized Dividend per Common Share) / (Cost of Equity – Dividend Growth Rate)
By estimating the dividends a company is likely to distribute at a constant rate and adjusting for the growth rate, you can estimate the intrinsic value of a stock. This model is particularly useful for evaluating companies with a stable dividend history and a manageable payout ratio — the portion of earnings paid out as dividends.
For example, if a company has an annual dividend of $2.00 per share, a cost of equity of 8%, and a constant dividend growth rate expected to be 3%, the DDM would look like this:
Current Stock Price = $2.00 / (0.08 – 0.03) = $40.00
According to this model, if the company’s stock is trading below $40.00, it may be undervalued.
An undervalued stock presents several opportunities for investors. The most attractive is the chance to purchase high-quality stocks at a discounted price. Investing in undervalued stocks can lead to significant long-term growth. If the market eventually recognizes the company’s true value and the stock price adjusts upwards, you stand to benefit from capital gains as the value of your investment increases. Essentially, you’d be buying low and selling high, which is a fundamental principle of investing.
Undervalued stocks often come with impressive dividend yields, typically because a company’s dividend yield is inversely related to its share price. If a company’s stock is undervalued, the dividend yield would be high in comparison. Even with a buy-and-hold stock, you can enjoy a predictable income stream from dividends while waiting for the stock’s price to appreciate.
Profit From Dividend Growth Stocks With Above the Green Line
Savvy investors pay attention to the dividend growth rate formula because it illuminates companies that are not only committed to returning value to shareholders through dividends but are also capable of doing so at an increasing rate over time. A portfolio with such investment choices can be a cornerstone for long-term income growth and capital appreciation.
Join Above the Green Line to explore the details of a dividend growth strategy that could potentially transform your approach to investing and escalate your financial progress. With the right strategy in place, you can take a proactive approach to building your wealth through smart, calculated investment moves that will make the most of the challenges posed by a changing market.

Related Articles
How to Use Net Present Value (NPV) for Dividend Stocks
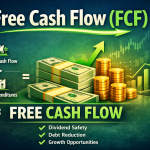
Free Cash Flow: The Ultimate Guide to Financial Strength and Dividend Sustainability

Dividend Reinvestment Plan (DRIP): How Automatic Reinvestment Builds Long-Term Wealth
Dividend Growth vs High Yield: Choosing the Right Income Strategy for Long-Term Investors