By ATGL
Updated October 15, 2025
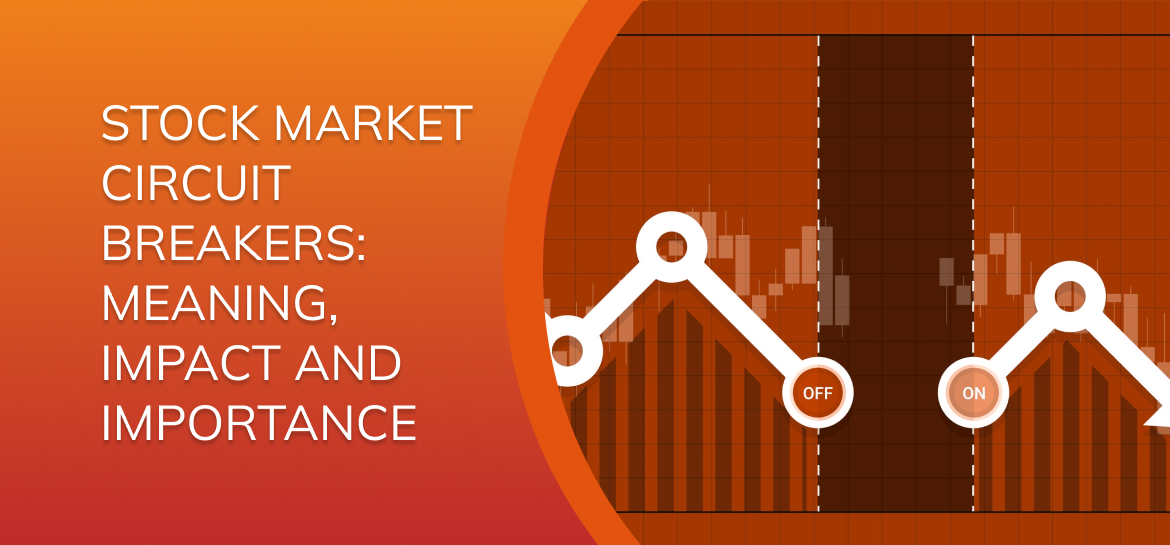
Circuit breakers are a core market‐protection tool. They are automatic, rules-based pauses that slow trading during extreme declines so participants can reprice risk, refresh orders, and reduce disorderly execution. If you trade intraday or manage client money, you should know exactly what triggers them, how long they last, how they interact with single-stock halts, and how to operate during and after a pause. The goal here is clarity, not length—everything you need, nothing extraneous.
What Are Circuit Breakers in the Stock Market?
Market-wide circuit breakers (MWCB) are temporary, exchange-coordinated halts that activate when the S&P 500 drops by a specified percentage from the prior close. They are designed to maintain orderly markets by reducing panic-driven executions and giving liquidity providers time to re-quote.
Separate from MWCBs, single-stock protections—primarily Limit Up–Limit Down (LULD) and volatility “trading pauses”—apply to individual securities when they move outside permitted price bands. For context on non-circuit-breaker halts (news pending, operational, IPO auctions), see Stock Trading Halts.
When Do Stock Market Circuit Breakers Kick In—and Why?
U.S. markets use a three-tier system keyed to the S&P 500’s decline from the prior day’s close:
- Level 1: −7% → 15-minute halt before 3:25 p.m. ET
- Level 2: −13% → 15-minute halt before 3:25 p.m. ET
- Level 3: −20% → trading stops for the remainder of the session
Timing matters:
- Level 1 and 2 do not apply at or after 3:25 p.m. ET.
- Level 3 applies any time it is reached.
The thresholds balance investor protection with market function. Short pauses at −7% and −13% allow for orderly re-openings without ending the session prematurely. A −20% decline indicates market conditions where closing for the day is more prudent than attempting multiple auctions into instability.
How far does the market have to fall to trigger a circuit breaker?
decline (%) = ((prior close − current index value) ÷ prior close) × 100.
What Triggers a Stock Market Pause During Volatility?
Market-wide triggers: The S&P 500 crossing −7%, −13%, or −20% from the prior close.
Single-stock triggers: LULD bands are calculated around a reference price and adjust throughout the session. If quotes attempt to trade outside the band for a brief period (commonly 15 seconds), the stock is paused ~5 minutes and then reopens via an auction. Bands vary by liquidity tier and time of day (wider at the open/close).
Pauses are not directional calls. They are procedural tools to improve the quality of price discovery.
How Long Is a Halt—and What Happens Next?
Market-wide halts
- Level 1 & 2: 15 minutes, then the market reopens through coordinated auctions.
- Level 3: The session ends; trading resumes the next scheduled day.
Single-stock LULD pauses
- Typically 5 minutes, extendable if the reopen auction cannot find a fair price within the band.
After any pause, expect wider spreads and uneven depth until liquidity normalizes. Use limit orders and confirm venue behavior with your broker’s specifications.
For broader volatility context before and after halts, review VIX Volatility Index and Analyze VIX Charts.
Individual Stock Halts vs. Market-Wide Circuit Breakers
| Feature | Market-Wide Circuit Breakers | Single-Stock LULD / Volatility Pauses |
|---|---|---|
| Trigger | S&P 500 down 7% / 13% / 20% vs prior close | Security trades or attempts to trade outside its band |
| Scope | All NMS equities and many ETFs | That security only |
| Duration | 15 minutes (L1/L2) or rest of day (L3) | ~5 minutes (extendable) |
| Purpose | System-level stabilization | Security-level price discovery |
| Your Focus | Portfolio risk, index futures, reopen imbalances | Halt reason, auction indications, paired volume |
Tip: If you see frequent single-stock pauses during a trend day, watch for exhaustion bars and late spikes; these often precede LULD events. See Identify the Spike Chart Pattern.
How Circuit Breakers Affect Orders, Liquidity, and Spreads
Circuit breakers interact with the microstructure. Your execution plan should account for the following:
- Market orders submitted pre-halt execute on the reopen and can slip materially if depth is thin. Prefer limit or stop-limit orders.
- Stop orders can cascade on reopen. If you use them, set price bounds with stop-limit instructions.
- Options markets widen considerably when an underlying is halted or an index is near a threshold. Routing and price-reasonability checks may reject overly aggressive orders.
- ETFs may print while components are paused, but pricing can be noisy. If precision is important, use limits and monitor imbalance feeds.
This is not about gaming the reopen; it is about controlling execution risk when the book rebuilds.
What Circuit Breakers Do—and Do Not—Accomplish
They do:
- Slow feedback loops where aggressive orders meet thin books.
- Provide a defined window for brokers and market makers to re-quote and manage inventory.
- Improve the odds of orderly reopen auctions.
They do not:
- Predict direction. Prices can continue lower or reverse after the halt.
- Guarantee narrow spreads or deep liquidity.
- Remove risk. They redistribute it over time and across the order book.
The actionable takeaway: treat halts as risk-management events, not as trading signals.
How Traders Should Respond When Circuit Breakers Are Triggered
A concise playbook prevents improvisation when spreads expand.
- Stabilize exposure
- Suspend new discretionary entries until spreads normalize.
- Verify stops/hedges on your largest positions. If you size risk by a fixed fraction, consider cutting r temporarily (e.g., risk per trade = 0.25–0.50 × normal).
- Use the pause productively
- Review index futures, reopen imbalance indications, ETF NAV gaps, and the VIX term structure.
- Note which groups show relative strength into the halt; these often lead on the reopen.
- Execute with control
- Use limits. Avoid chasing the first post-halt print unless your tested plan calls for it.
- If you scale, add after a two-sided tape returns and auctions clear.
- Conduct a post-session review
- Document whether the day triggered Level 1/2/3.
- Log execution quality and which names maintained or lost relative strength.
- Update rules for next time; refine order types and size caps for stress days.
Historical Perspective: What Recent Halts Taught Traders
During March 2020, the U.S. market triggered several Level 1 halts. The pauses did not suppress volatility, but they did structure it. Traders who adapted quickly tended to:
- Reduce position size rather than setting stops so tight that normal reopen noise forced exits.
- Favor liquid instruments (index futures/ETFs) over thin single names while depth rebuilt.
- Track relative strength by sector to find the first areas where two-sided trading returned.
- Use VWAP as an anchor after reopen; sustained acceptance above or below session VWAP often distinguished continuation from retracement.
These practices remain applicable to any macro-driven stress event.
Practical FAQs
What are circuit breakers in the stock market?
Automated, rules-based halts triggered by large index declines to maintain orderly markets.
When do stock market circuit breakers kick in?
At −7%, −13%, and −20% on the S&P 500 relative to the prior close. Level 1/2 halt for 15 minutes before 3:25 p.m. ET; Level 3 ends the session.
What triggers a stock market pause?
Either the market-wide thresholds above or single-stock LULD bands being breached for a sustained interval.
How far does the market have to fall to trigger a circuit breaker?
decline (%) = (prior close − current index) ÷ prior close × 100 must meet 7%, 13%, or 20%.
How long is a stock halted due to volatility?
Market-wide Level 1/2: 15 minutes; Level 3: rest of day. Single-stock LULD: ~5 minutes (extendable).
A Focused Checklist You Can Use
- Know the thresholds and the 3:25 p.m. ET timing rule.
- Default to limit / stop-limit orders in stressed conditions.
- Reduce risk per trade as VIX rises; re-expand only after spreads normalize.
- Track reopen imbalances and VWAP for post-halt structure.
- Review and log each event to improve your execution the next time.
For additional background on stress regimes and intraday patterns, see VIX Volatility Index, Analyze VIX Charts, and Identify the Spike Chart Pattern.
Join ATGL for a Rules-Based Approach to Volatility
You cannot time every headline, but you can operate with a disciplined plan. Above the Green Line (ATGL) emphasizes a rules-driven process—relative strength, moving averages (including our Green Line), and clear risk budgets—to remove emotion when markets move fast. If you want structured market notes, curated lists, and a community focused on execution, consider becoming a member: ATGL Memberships.


