Above the Green Line -01
  • Market Insights
        • Commentary
          • Daily
          • Weekly
        • BUY / SELL SIGNALS
          • Trade Posts
          • Recent Trade Alerts
          • Recent Day Trades
        • BLOGROLL
          • Dividend Growth Blog
          • ETF Sector Blog
          • Dow Dogs
          • TPOW Blog
  • Strategies
        • SWING TRADING
          • Current Positions
          • Watchlists
          • Closed Positions
          • Candidates - TOP 100
          • Specialty Stocks
        • WEEKLY STOCK PICK
          • TPOW Charts
          • TPOW Performance
          • TPOW Strategy Guide
          • TPOW Performance Dashboard
        • DAY TRADING
          • Watch List
        • ATGL DASHBOARD
        • ETF STRATEGIES
          • ETF Sector Rotation
          • ETF Sector Portfolio
        • DIVIDEND GROWTH
          • Dividend Growth Portfolio
          • Dividend Calendar
        • DOGS OF THE DOW
          • Dogs of the Dow Portfolio
          • DOW 5 Portfolio
  • Markets
        • US MARKET
          • Commodities
          • Energy
          • Precious Metals
          • Volatility
        • GLOBAL MARKETS
          • Market Indices
          • Economic Calendar
          • FOREX Heat Map
          • FOREX Cross Rates
          • Crypto Currency Market
  • Investing
    • Discord Community
    • Dashboard
  • Resources
        • ARTICLES
          • Dividend Growth Model Articles
          • ETF Articles
          • Investment Strategies Articles
          • Market and Economic Insights
          • Stock Trade Articles
          • Stock Reviews
        • TOOLS
          • Stock Scanners
          • Charting Software
          • Brokerage Firms
        • STOCK CHARTS
          • Key Components
          • Reading Charts
          • Drawing Stock Charts
          • Identifying Trends
        • RETIREMENT PLANNING
  • About
    • Contact Us
    • How to Win
    • #1 At Stockcharts
    • Disclaimer
    • FAQ
  • Log In
  • Subscribe

August 12, 2020

S&P 500

S&P 500

Source

What is the S&P 500?

The S&P 500 is a stock market index that tracks the largest 500 publicly traded U.S. companies. Investors have long used the S&P 500 as a benchmark for their investments as it tends to signal overall market health. The S&P 500 is a “free-floating index” meaning that it only takes into consideration the health and price of shares that are publicly traded; it does not consider government-owned or privately-owned shares. The index is a popular choice for long-term investors who wish to watch growth over the coming decades. As of March 2020, the S&P yielded a 10-year annual return of 7.99%. Due to its success and its low-risk nature, the S&P 500 has become one of the top indexes available for investors to buy into.

How Does It Work?

Construction

The S&P 500 works by tracking the market capitalization of companies within its index. Market capitalization refers to the total dollar market value of a company’s outstanding shares and is calculated by multiplying the number of outstanding shares times the market price. The index periodically adjusts the market capitalization of the 500 companies as companies add or take away shares from the market. Apple’s upcoming 4-1 split is a perfect example. Effective August 21st, Apple’s stock will split; the price will be reduced by ¼ and the number of available shares will increase 4 times. The market capitalization of a company is essential to the S&P 500 as each company’s weight within the index depends on its market capitalization. For example, a company that has a market capitalization of $50 billion receives 5 times the representation as a company that has a market cap of $10 billion. The weight of a company within the index is important, as changes to a large company will affect the value of the S&P greater than the changes to a small one. As of February 2020, the S&P 500 had a total market capitalization of $24.4 trillion, meaning that the index captured 80% of the market capitalization within the stock market.

How Companies Are Selected

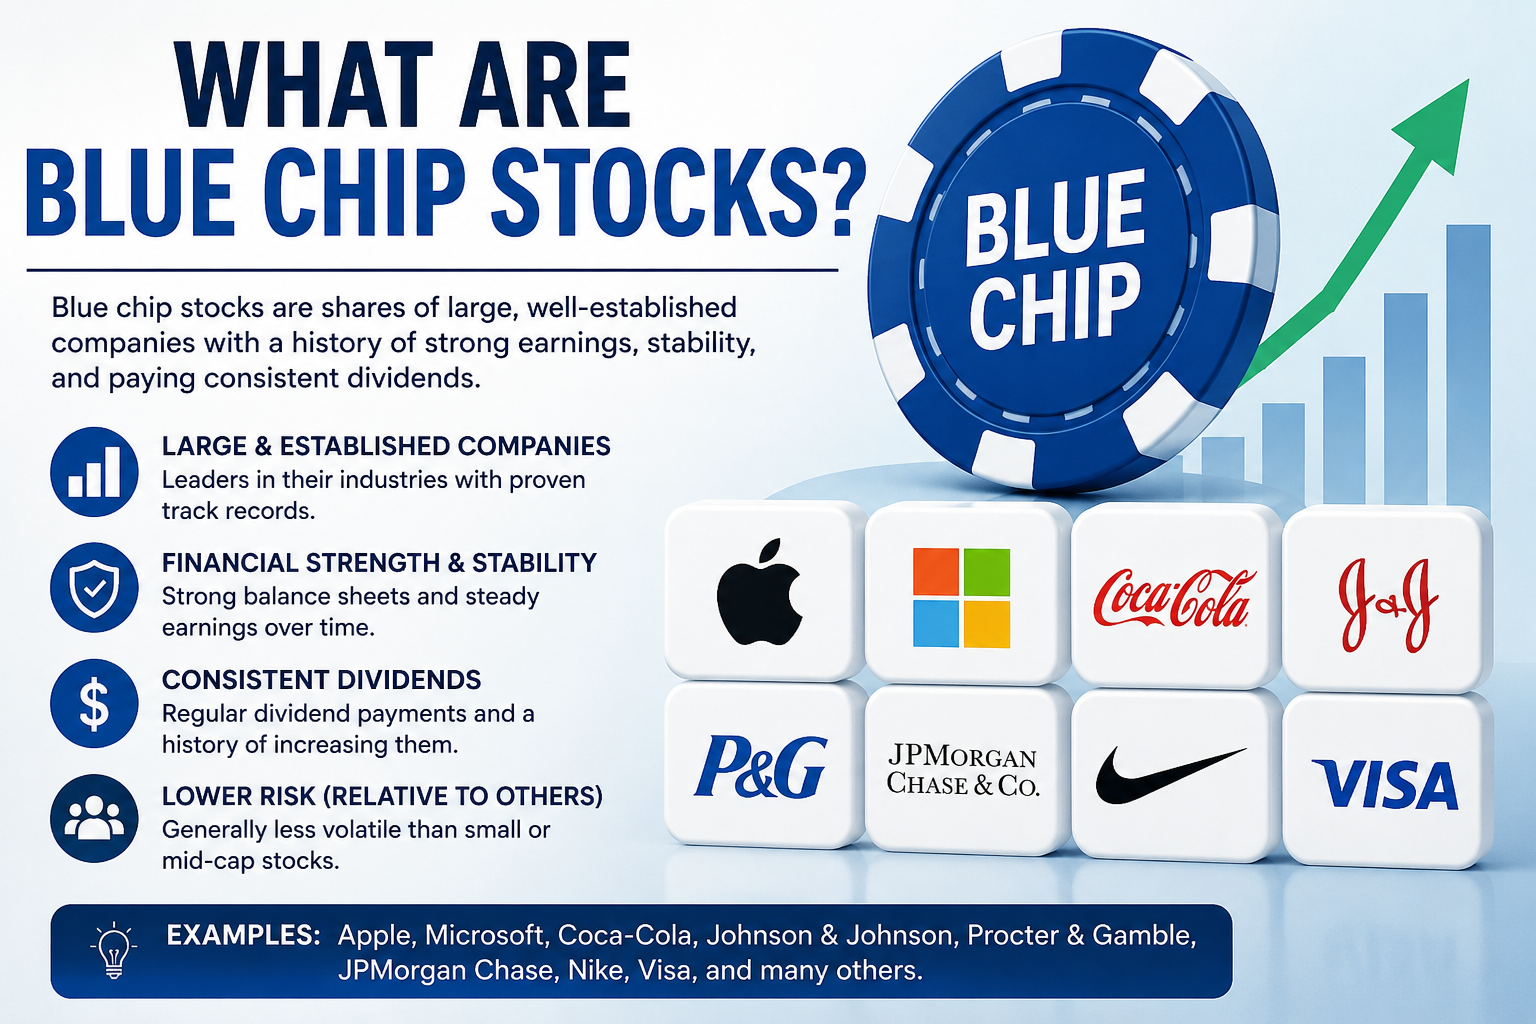
Quarterly, a committee meets to select the index’s 500 companies based on their industry, size, and liquidity. For a company to qualify, they must be based within the U.S., have a minimum market capitalization of $8.2 billion, and at least 50% of the shares must be available to be publicly traded. Additionally, the stock price must be at least $1.00 a share and the corporation must have four consecutive quarters of positive earnings. As of March 2020, the top 10 largest companies within the S&P 500 were Microsoft Corp, Apple Inc, Amazon.com Inc, Facebook Inc. A, Berkshire Hathaway B, Alphabet Inc. A (GOOGL), Alphabet Inc. C (GOOG), JP Morgan Chase & Co, Johnson & Johnson, and Visa Inc. A.

Risks

One potential risk or limitation of the S&P 500 is that a stock may become overvalued. Thus, if the stock is overvalued, it could have a large weight within the index which would inflate the value of the index as a whole. Large market capitalization is not indicative of great company health; it simply reflects a stock’s value compared to its outstanding shares. As such, equal-weighted indexes have risen in popularity during recent years.

Conclusion

The S&P 500 is a leading economic indicator of overall market health within the country. Since it tracks the largest 500 companies, the composition of the index is generally reflective of the U.S. economy as a whole. If investors feel confident about the economy, they will buy shares of stock and the S&P will continue to rise. The S&P 500 is thoroughly composed using strict criteria and quarterly meetings that ensure only the best companies will weigh within the index. It has historically been viewed as a safe and profitable long-term investment. However, an investor does not have to buy shares of the index in order to make profitable choices. By tracking the movements of the S&P, an investor can attain an overall sense of market conditions and buy shares of large companies independently from the index.


Related Articles

Stock Trading

Stock Trading 101: A Comprehensive Guide to Mastering the Markets

Stock trading represents one of the most dynamic aspects of modern investing, offering opportunities for financial growth alongside significant challenges ...
Read More
Market Breadth Indicators

Market Breadth Indicators: Spot Trend Momentum Before It’s Obvious

Stock prices tell only part of the market’s story. While index movements capture headlines, the underlying participation and strength of ...
Read More
V Chart Patterns

How to Trade the V Pattern Chart Using Volume and Momentum

Sharp reversals catch traders unprepared. These aggressive recoveries, driven by heavy volume and strong momentum, often signal institutional involvement. The ...
Read More
Channel Patterns

Trading Channel Patterns: Full Guide to Ascending & Descending Breakouts

Technical analysis provides traders with powerful tools to identify potential market movements before they occur. Channel patterns provide some of ...
Read More
Spike Chart Patterns

Spike Chart Pattern Strategy: Reacting Fast to Price Surges

Sudden price increases create unique patterns on trading charts that investors need to notice quickly. These quick movements, known as ...
Read More
Broadening Bottom Pattern

Broadening Bottom Pattern Guide: Data-Driven Signals for Buy Setups

Chart patterns are the foundation of technical analysis, providing traders with visual frameworks to anticipate market movements and capitalize on ...
Read More

Subscribe to Our Newsletter

AGL Logo

Get our eBook Now!

Candlestick - A Swing Traders Friend

We don’t spam! Read our privacy policy for more info.

You’ve been successfully subscribed to our newsletter!

Voted #1 at Stock Charts

SH Chart
Inverse S&P 500 Fund (SH) will have a Money Wave Buy today.

Help Us Help Animals

Help Us Help Animals

Recent Comments

  • Market Breadth Indicators: A Trader’s Guide to Early Trend Detection on Backtesting: Definition and How a Trading Strategy Backtest Works
  • Island Reversal Pattern: Definition and Formation Explained on Double Top Pattern: How to Identify and Trade This Reversal Signal
  • Channel Pattern Guide: What It Is and Why It Matters on A Guide to Forecasting Using Moving Averages
  • What Is a Broadening Bottom Chart Pattern? Full Guide on Bull vs. Bear Market: An Investor’s Guide to Market Phases
  • ATGL Weekly Money Flow - 2025-05-11 on ATGL Top Pick of the Week! Apr 6, 2025

Become a Green Liner!

Help me make more Money in the Stock Market.

ON ATGL

  • DashBoard
  • Weekly Commentary
  • Daily Buy / Sell Signals
  • Day Trade Setup
  • Trading Rooms

Design & Develop By Pixelvect

STRATEGIES

  • Swing Trading
  • ATGL Pick of the Week
  • Dividend Growth
  • ETF Sector Rotation
  • Dogs of the Dow

HELP

  • ATGL Trading Rules
  • FAQ
  • Account Maintenance
  • Contact US
  • Join

FOLLOW US

Instagram Linkedin Twitter Facebook

© COPYRIGHT 2024 · ABOVETHEGREENLINE.COM · ALL RIGHTS RESERVED · PRIVACY · TERMS · CONTACT · WATCHLIST · CURRENT