
By ATGL
Updated September 24, 2025
The scallop pattern is one of technical analysis’s most reliable reversal indicators. This distinctive chart formation provides clear signals for anticipating market reversals across various trading instruments, offering you valuable timing opportunities for both bullish and bearish scenarios.
What Is the Scallop Pattern?
The scallop pattern is a technical formation that signals potential trend reversals, consisting of a rounded, curved section followed by a sharp directional move. This pattern captures transitions in trader sentiment before explosive price movements, helping you identify when market momentum shifts direction.
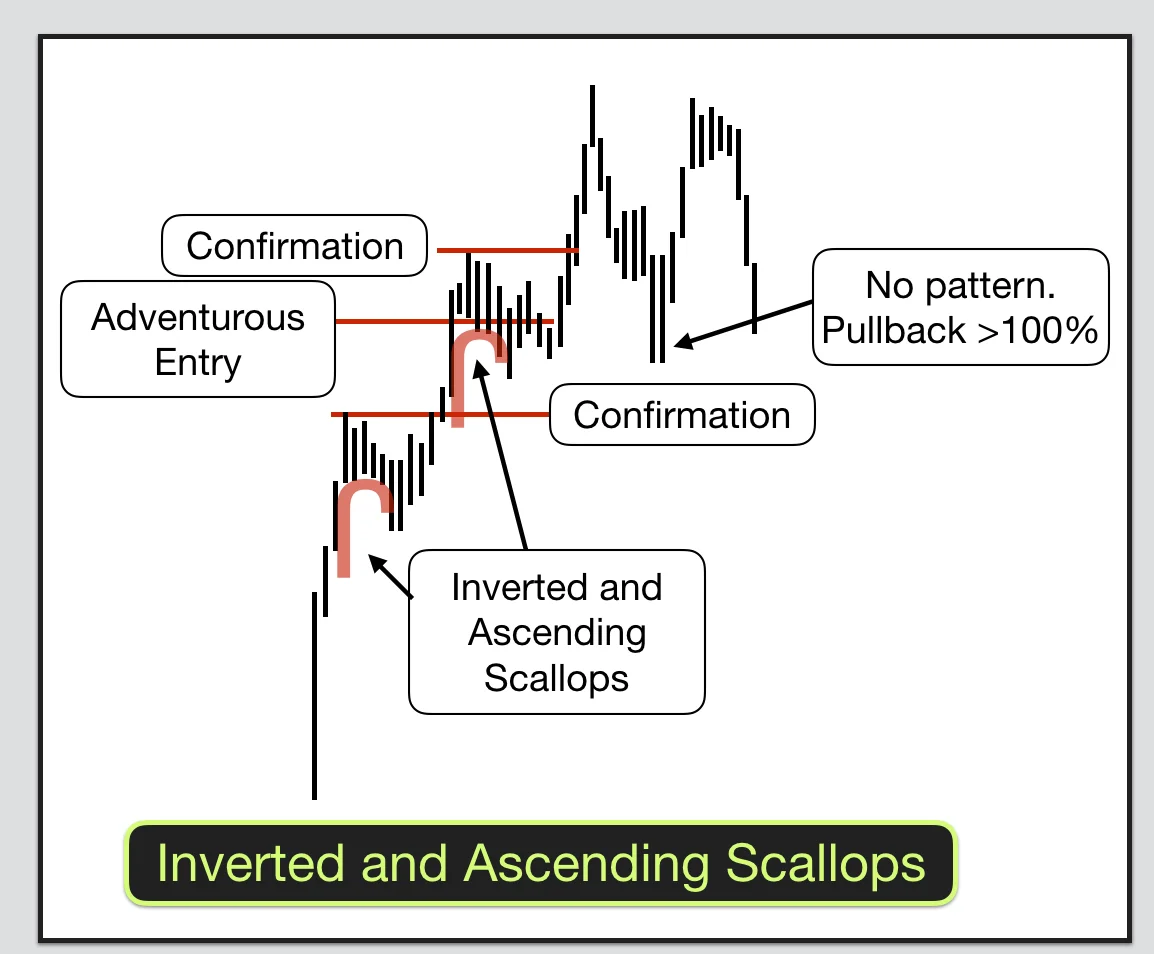
The ascending scallop pattern resembles an upside-down “J” and forms during downtrends before bullish reversals. It begins with sustained downward movement, transitions into a rounded bottom where selling pressure diminishes, then accelerates upward sharply. The pattern completes when prices close above the highest point of the rounded portion, indicating buyers have regained control of the scallop market.
The descending scallop trade pattern appears as a right-side-up “J” during uptrends before bearish reversals. Upward trends transition into rounded tops where buying pressure weakens, followed by sharp downward acceleration confirming bearish reversals when prices break below the rounded section’s lowest point.
The rounded portion typically retraces approximately 50% of the initial price movement. Retracements exceeding 70% may invalidate the pattern, suggesting insufficient momentum for anticipated reversals.
Bullish vs. Bearish Scallops
The bullish scallop pattern emerges during established downtrends, signaling potential upward reversals when selling pressure exhausts itself and buyers begin gaining control. The rounded bottom phase shows decreasing volatility and diminishing bearish momentum, while subsequent sharp upward moves demonstrate renewed buying interest and institutional accumulation.
This formation indicates that sellers are losing conviction while buyers build confidence, creating conditions for sustained upward movement. The pattern’s effectiveness increases when it forms after significant declines, as oversold conditions often trigger substantial reversals.
Conversely, the descending scallop appears during sustained uptrends, forecasting downward reversals when buying pressure systematically weakens and sellers gain dominance. The rounded top reflects gradual momentum loss among bulls, often accompanied by profit-taking behavior. This consolidation phase builds selling pressure, culminating in accelerated selling that drives prices sharply lower.
Both variations share similar structural characteristics but occur in opposite market contexts. The key distinction lies in their preceding trends and subsequent price directions, requiring careful analysis of broader market trends and economic conditions before determining pattern type and trade direction.
How To Spot the Scallop Pattern on Charts
Successful identification requires recognizing formation characteristics that develop over several weeks to months. Volume analysis provides crucial validation, with declining volume during rounded phases indicating diminishing trend interest, followed by increasing volume during breakouts confirming directional commitment.
The bullish scallop pattern requires established downtrends with clear lower highs and lower lows. Bearish scallops need sustained uptrends with higher highs and higher lows. The rounded phase typically spans three to eight weeks, characterized by decreasing volatility and converging price action.
Scallop patterns manifest most effectively on daily and weekly charts where sufficient price data allows proper development. Daily charts offer an optimal balance between clarity and frequency, while weekly charts provide more reliable signals but fewer opportunities.
Pattern confirmation occurs when prices close decisively above the rounded top for bullish setups or below the rounded bottom for bearish configurations. Look for at least two consecutive closes beyond the breakout level to validate signals and reduce false breakout risks. Measure the pattern’s height from extreme points to establish realistic profit targets.
Psychology Behind the Pattern
The scallop pattern captures fundamental shifts in market psychology during trend transitions. Initially, one market side dominates completely, but this dominance gradually weakens due to profit-taking and changing market conditions.
The rounded phase represents psychological transitions where previously dominant groups lose conviction while opposing groups build confidence. This gradual sentiment shift creates the curved appearance, with neither buyers nor sellers maintaining complete control during consolidation.
Market momentum dissipates during rounding phases as confident traders reduce positions, creating small pullbacks and recoveries as markets seek direction. The pattern’s effectiveness stems from capturing complete sentiment shifts rather than temporary pauses. This gradual transition, followed by explosive breakouts, creates high-probability opportunities by telegraphing the scallop market’s intention to reverse definitively.
Entry, Exit, and Risk Management Strategies
Conservative traders should wait for complete pattern confirmation before entering trades. For bullish patterns, enter long positions after prices close above the rounded section’s highest point with confirming volume. For bearish patterns, enter short positions after prices close below the rounded portion’s lowest point with volume confirmation.
Aggressive traders may enter earlier during pattern development after rounded phases show clear reversal characteristics. This approach offers improved risk-reward ratios but increases false signal probability and requires sophisticated risk management.
Place stop-losses below rounded bottoms for bullish trades and above rounded tops for bearish trades, offering protection while preventing premature exits from minor retracements.
Calculate price targets using the pattern height measurement formula: measure the distance from the pattern’s extreme point to the breakout level, then project this distance from the breakout point in the trade direction.
Common mistakes include entering before pattern completion, ignoring volume confirmation, and failing to consider broader market contexts. Success requires patience, discipline, and comprehensive analysis, including volume patterns and prevailing market conditions.
Using the Scallop Pattern With Other Tools
The scallop pattern becomes more powerful when combined with complementary technical indicators. Moving averages help confirm trend direction and reversal points, with patterns forming near significant moving average levels showing higher reversal probabilities.
The Relative Strength Index (RSI) provides additional confirmation through divergence analysis. Bullish scallops with oversold RSI readings offer higher probability trades, while bearish scallops coinciding with overbought conditions present attractive short opportunities.
Consider broader market context when evaluating patterns, as those aligning with major trading strategies and market cycles produce more reliable results. Sector rotation and economic cycles also influence effectiveness, with scallops in trending sectors generating stronger moves than those in stagnant environments.
Avoid trading patterns lacking clear preceding trends, insufficient volume confirmation, or forming during volatile periods. Multiple failed completion attempts indicate market weakness, suggesting alternative trading patterns may be more suitable.
Improve Your Portfolio With Scallop Patterns
The scallop pattern offers traders a sophisticated tool for identifying and capitalizing on major market reversals. By understanding pattern structure, formation psychology, and implementation strategies, you can significantly enhance trading performance and portfolio returns. Success requires patience, discipline, and continuous learning as market conditions evolve.
Above the Green Line’s comprehensive membership program provides access to real-time market analysis, expert guidance, and proven strategies that can help you successfully identify and trade scallop patterns along with other profitable formations.

Related Articles

Margin Call Explained: What Triggers It and How to Avoid One

AMC Short Squeeze Explained: Timeline, Causes, and Trading Risks

Volatility Clustering in Financial Markets: Understand Why It Happens

Chaikin Money Flow (CMF): How to Use Volume to Spot Real Market Strength
