
By ATGL
Updated May 1, 2025
In technical analysis, price action often moves in identifiable patterns. Among the most common and reliable is the rectangle pattern — a formation that reflects a period of consolidation before the price breaks out in one direction. For traders aiming to make strategic, emotion-free investment decisions, recognizing this setup can lead to consistent returns, especially when paired with clear indicators for trading.
Understanding the Rectangular Pattern
A rectangular pattern represents a phase where the market pauses, reflecting a temporary equilibrium between buyers and sellers. Prices oscillate between a defined support level and a resistance level, forming horizontal boundaries that resemble a box or rectangle on the chart.
This period of sideways price action is neither random nor insignificant. It indicates market indecision, where neither bulls nor bears dominate, and the price stabilizes within a range. Despite its apparent calmness, this pattern often precedes powerful price moves once a breakout occurs.
The rectangular shape of the pattern reflects a clear equilibrium zone. Buyers repeatedly enter at support, while sellers dominate at resistance. Recognizing this range-bound behavior allows traders to anticipate future price movement once the balance shifts decisively.
How To Identify the Rectangle Pattern
Successfully identifying a rectangle pattern depends on understanding its technical characteristics. Key traits include:
- Parallel Support and Resistance Lines: The top and bottom of the pattern align with relatively equal highs and lows, forming a horizontal channel.
- Price Consolidation: The asset trades within this range for a period, indicating equilibrium in supply and demand.
- Equal Highs and Lows: Price repeatedly tests resistance and support levels without breaking them, showing strong boundaries.
- Volume Analysis: Typically, volume diminishes during the pattern’s development and increases sharply at breakout.
- Duration: Rectangle formations can last from several days to several months. Longer patterns often precede more substantial breakouts.
Paying attention to volume is critical. During consolidation, volume often declines, signaling reduced conviction from both buyers and sellers. A breakout with a sharp volume increase strengthens the validity of the move, helping traders distinguish genuine breakouts from false signals.
Using these criteria alongside tools like moving averages or stochastic indicators can enhance pattern recognition and improve entry timing.
Types of Rectangle Patterns
One of the most common questions is: Is a rectangle pattern bullish or bearish? The answer depends on the direction of the breakout. Most often, the rectangle is a continuation pattern, meaning it signals a pause before the prevailing trend resumes. However, it can also mark a reversal in rare cases, which is why breakout confirmation is critical.
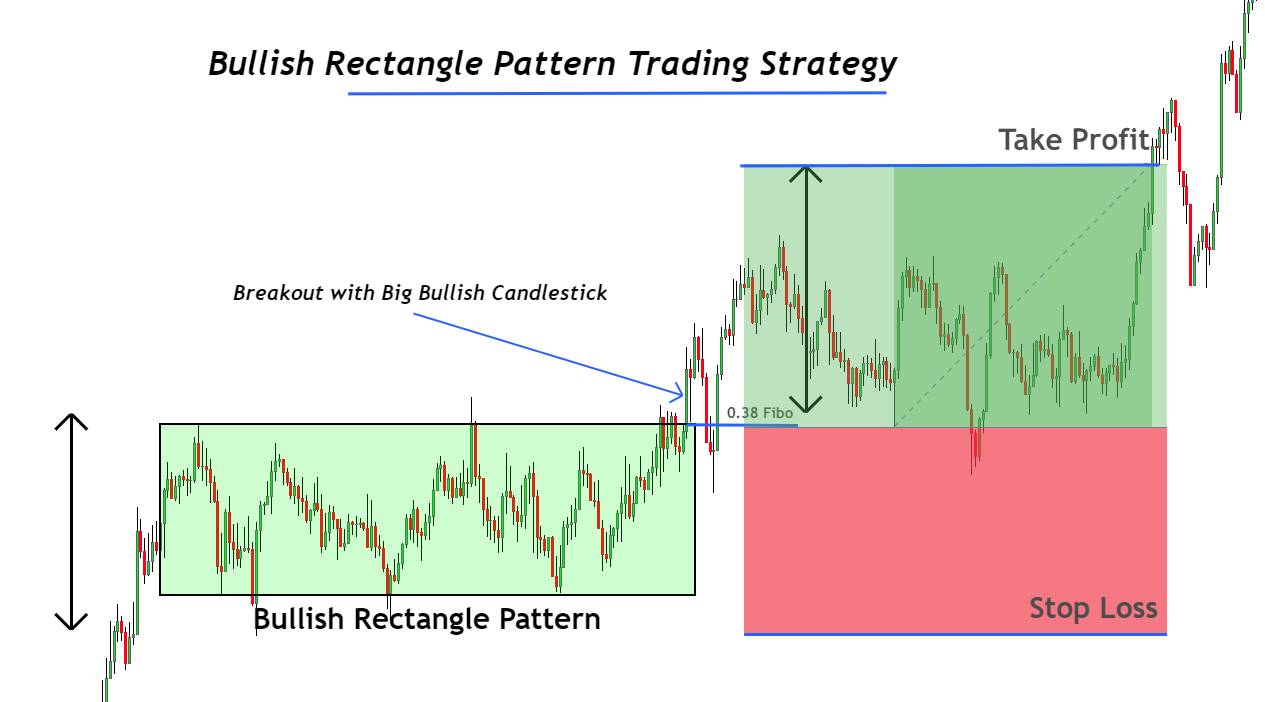
Bullish Rectangle Pattern
A bullish rectangle pattern occurs during an uptrend when the price enters a consolidation phase but ultimately breaks out to the upside. It reflects temporary resistance as profit-taking sets in, yet buyers remain strong enough to maintain support.
Key Features:
- Occurs in uptrends
- Price bounces between resistance and support
- Volume contracts during consolidation
- Breakout to the upside confirms continuation
Traders may set buy orders slightly above the resistance level to enter positions as momentum resumes upward.
Bearish Rectangle Pattern
In contrast, a bearish rectangle pattern emerges during a downtrend. It indicates a pause in bearish momentum but ultimately breaks down further as sellers regain control.
Key Features:
- Appears in a downtrend
- Defined horizontal range
- Volume fades during consolidation
- Bearish breakout confirms downtrend continuation
Short positions can be initiated just below the support level to capitalize on renewed downside movement.
Strategies for Trading Rectangle Patterns
To profit from the rectangle pattern, traders should tailor their strategies to the breakout direction:
1. Breakout Entry Strategy
- For Bullish Rectangle: Buy when price closes above the upper resistance. Confirm with increasing volume.
- For Bearish Rectangle: Sell short after price breaks below support. Again, volume confirmation is crucial.
2. Pullback Re-entry
- After a breakout, wait for a retest of the broken level (support becomes resistance or vice versa) for a lower-risk entry.
3. Measured Move Target
- Estimate the price target by measuring the rectangle’s height and projecting it from the breakout point. This technique applies to both bullish and bearish patterns.
4. Use Stop-Loss Orders
- Place stops just below support (bullish) or above resistance (bearish) to protect against false breakouts.
Incorporating trade alerts or automated entry systems can enhance execution, especially in fast-moving markets. For those focused on disciplined investing, using rectangle formations to time entries and exits helps remove emotion from decision-making and supports systematic portfolio growth.
Recognizing Market Consolidation
A rectangle formation is essentially a visual representation of market consolidation. Understanding the forces behind it helps validate the pattern:
Supply and Demand Balance
During the rectangle phase, buying and selling pressures are evenly matched. Traders must monitor volume trends and price reactions to identify when this balance begins to shift, potentially signaling an upcoming breakout.
Sideways Market Movements
This type of movement can frustrate directional traders, but it presents opportunities for those who wait patiently for confirmation. Sideways trends often occur before earnings reports, macroeconomic events, or major news catalysts, where uncertainty causes investors to pause.
Leverage the Rectangle Pattern Formations
Integrating the rectangle pattern trading technique into a broader strategy requires discipline and systematized analysis. Here’s how to extract maximum value:
- Use charting platforms with reliable types of stock charts that clearly display support and resistance.
- Combine rectangle identification with technical indicators for trading, such as RSI, MACD, or moving averages, to filter low-probability setups.
- Subscribe to timely trade alerts to avoid missing breakout opportunities.
Traders who consistently apply these rules gain a tactical edge by entering positions aligned with the breakout’s momentum rather than guessing market direction.
Understanding what a rectangle pattern indicates about market behavior — namely, a standoff between supply and demand — enables more strategic entries and exits. And knowing how you can profit from breakouts after a rectangle consolidation allows for preemptive trade planning and risk management.
By mastering the best strategies for trading rectangle patterns, you can reduce emotional decision-making and adhere to a more systematic approach, which is exactly the foundation we use at Above the Greenline.
Our memberships provide access to curated trade alerts, chart setups, and model-driven insights designed to help you identify high-probability opportunities before the breakout happens. Join us to take a more structured and data-backed approach to investing.

Related Articles

Margin Call Explained: What Triggers It and How to Avoid One

AMC Short Squeeze Explained: Timeline, Causes, and Trading Risks

Volatility Clustering in Financial Markets: Understand Why It Happens

Chaikin Money Flow (CMF): How to Use Volume to Spot Real Market Strength
