By ATGL
Updated August 22, 2025
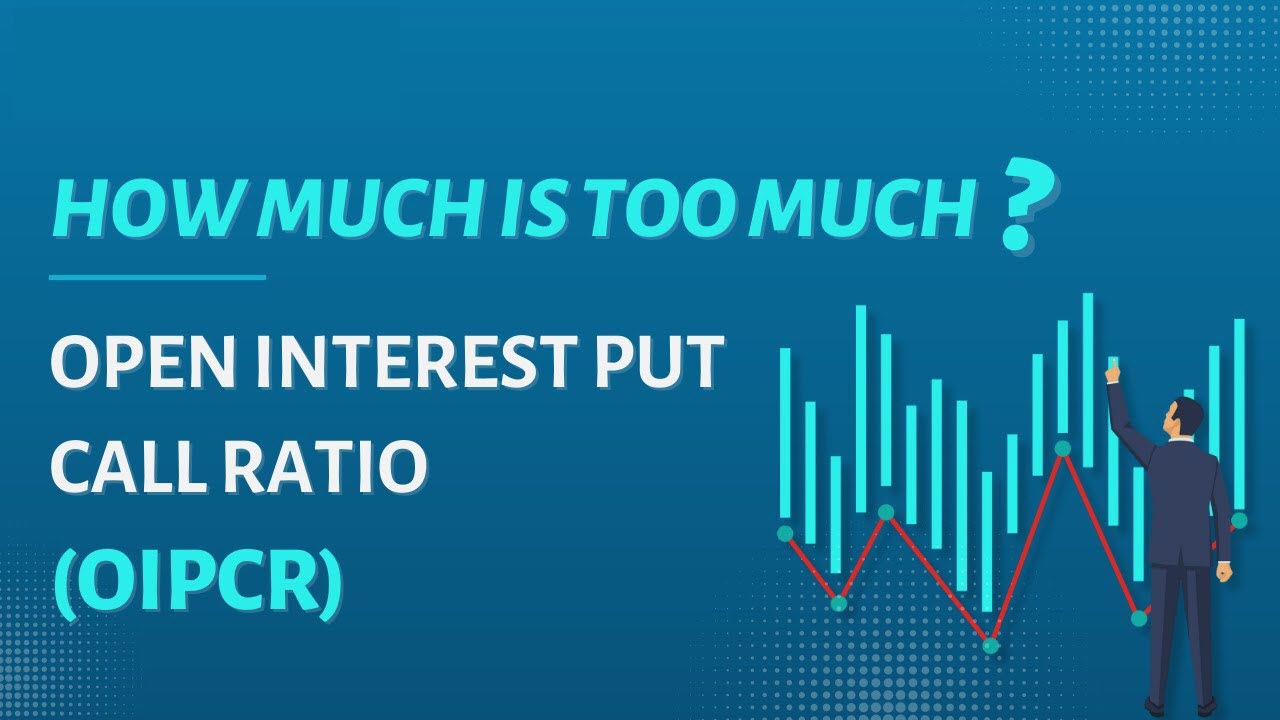
Understanding options market sentiment is a critical advantage for traders. The put-call open interest ratio (PCR OI) offers insight into how market participants are positioning, helping you evaluate whether sentiment leans bullish, bearish, or neutral. By analyzing this ratio, you can anticipate potential reversals, confirm developing patterns, and refine your overall strategy.
This article explains what the put-call OI ratio is, how to interpret its values, how it compares to volume-based PCR, and how you can use it in practice.
How the Put-Call Open Interest Ratio Measures Market Sentiment
The put-call open interest ratio is calculated by dividing total open interest in put options by total open interest in call options:
PCR OI = Put Open Interest ÷ Call Open Interest
Open interest represents the total number of outstanding option contracts that remain unsettled. Unlike volume, which measures contracts traded during a specific session, open interest reflects the overall accumulation of positions. This distinction makes the PCR OI a more stable gauge of market sentiment compared with its volume-based counterpart.
A reading near 1 generally indicates balanced sentiment, meaning traders hold similar levels of puts and calls. A ratio above 1 suggests that more puts are outstanding than calls, signaling a bearish tilt. Conversely, a ratio below 1 points toward a bullish bias as calls outweigh puts.
Interpreting Sentiment Signals
- High ratio (>1): Indicates that investors are holding more protective or speculative bearish positions.
- Low ratio (<1): Reflects stronger demand for calls, suggesting bullish expectations.
- Around 1: Implies neutral sentiment or indecision.
A common question is: What is a good put-call OI ratio? The answer depends on context. A ratio between 0.7 and 1.0 often represents a healthy balance. Extreme values, such as above 1.5 or below 0.5, may hint at overextended sentiment, which can precede a reversal. This can be especially relevant during market reversals, where crowd positioning becomes overly concentrated on one side.
Use as a Contrarian and Trend Tool
The PCR OI is often applied in two ways. First, as a contrarian indicator: When readings reach extreme levels, traders may position against the crowd, expecting sentiment to reverse. Second, as a trend confirmation tool: When the ratio steadily moves higher or lower in alignment with price action, it strengthens the signal that momentum is building in that direction.
Interpreting Extreme Values in Put-Call Interest Ratio
Extreme values in the put-call interest ratio are rare but significant. For example, if the ratio spikes above 2.0, it shows that traders are heavily positioned in puts, reflecting elevated bearishness. Such levels often occur near market bottoms, as excessive fear leads to capitulation.
On the other hand, a ratio near 0.4 or lower demonstrates aggressive call buying. While this may reflect optimism, extreme bullishness can signal overconfidence and precede corrections. Traders often compare these levels to historical averages within a given index or security to determine whether the current reading is unusually stretched.
Tracking both put volume and call volume alongside open interest trends can provide greater context around the intensity of current sentiment and the types of trades being initiated.
How To Track Put Call OI Ratio Over Time
Isolated readings can mislead if taken out of context. Monitoring the put-call OI ratio across days or weeks helps you identify evolving sentiment trends. For instance:
- A gradual increase in the ratio alongside declining prices confirms bearish conviction.
- A falling ratio with rising prices strengthens the bullish case.
- Divergences, such as a climbing ratio while the market rallies, may indicate weakening support for the trend and potential reversal.
By plotting the PCR OI alongside price charts and indicators like moving averages, you can better visualize sentiment shifts and align with technical indicators to confirm trade setups.
Comparing Put-Call OI Ratio With Other Indicators
The put-call OI ratio provides valuable signals, but it works best when combined with complementary indicators. For instance:
- Options volume: High volume confirms active conviction behind open interest changes.
- VIX: Rising implied volatility paired with a high PCR OI often confirms heightened fear.
- Dark pool activity: Monitoring institutional flows can validate whether sentiment shifts in open interest are being echoed in off-exchange trading.
Integrating these tools helps filter out false signals and improve decision-making, especially during periods of heightened market volatility.
Practical Applications for Traders
A practical scenario can illustrate the utility of the put-call interest ratio. Consider a period when the S&P 500 index declined for several weeks, pushing the PCR OI above 1.5. Shortly afterward, the index rebounded sharply, validating the contrarian interpretation.
In another case, a steady decline in the PCR OI during a prolonged uptrend confirmed that optimism was building gradually, allowing swing traders to remain confident in their long positions.
Combining ratio analysis with technical approaches such as identifying trends or studying bullish versus bearish sentiment strengthens trading setups and reduces reliance on any single signal.
Limitations and Considerations When Using Put-Call OI Ratio
While the put-call OI ratio is a powerful sentiment tool, it is not infallible. You should account for several limitations:
- Context dependence: A high ratio may signal bearish sentiment, but it can also reflect hedging by institutional investors rather than outright pessimism.
- Market anomalies: Sudden surges in option activity linked to earnings announcements or macro events can distort the ratio.
- Not a standalone tool: Relying solely on PCR OI without confirming signals from other indicators increases the risk of false interpretations.
A common question arises: What if put OI is higher than call OI? This scenario indicates a higher demand for downside protection or bearish speculation, pushing the ratio above 1. The takeaway is not to interpret it automatically as bearish but to evaluate whether the positioning aligns with broader market behavior.
Enhance Your Trading Strategy With Put-Call OI Ratio Insights
The put-call open interest ratio is a direct window into options market sentiment. By analyzing shifts in open interest and recognizing extreme values, you can better anticipate potential reversals or validate existing trends. However, the most effective approach is to integrate PCR OI with supporting tools like options volume, VIX, and institutional flow data.
Above the Green Line emphasizes a systematic, signal-based approach to trading. Incorporating the put-call OI ratio into your strategy allows you to make informed, disciplined decisions rather than reacting emotionally to market swings.
Discover how a membership with Above the Green Line can support more disciplined, data-driven trading decisions.


[…] typically reflects building momentum in one direction. Analyzing these patterns in context with the put/call open interest ratio can provide additional insight into market sentiment across strikes and expiration […]