
Understanding Order Flow and Its Importance in Trading
Order flow refers to the real-time buying and selling activity in a financial market, providing a detailed insight into how market participants are placing and executing orders. It allows traders to see not just price movement, but also the volume and direction of orders, giving them a better understanding of market sentiment and liquidity. By analyzing order flow, day traders and swing traders can gain a competitive edge in predicting short-term price movements, identifying trends, and making informed decisions that can lead to more profitable trades.
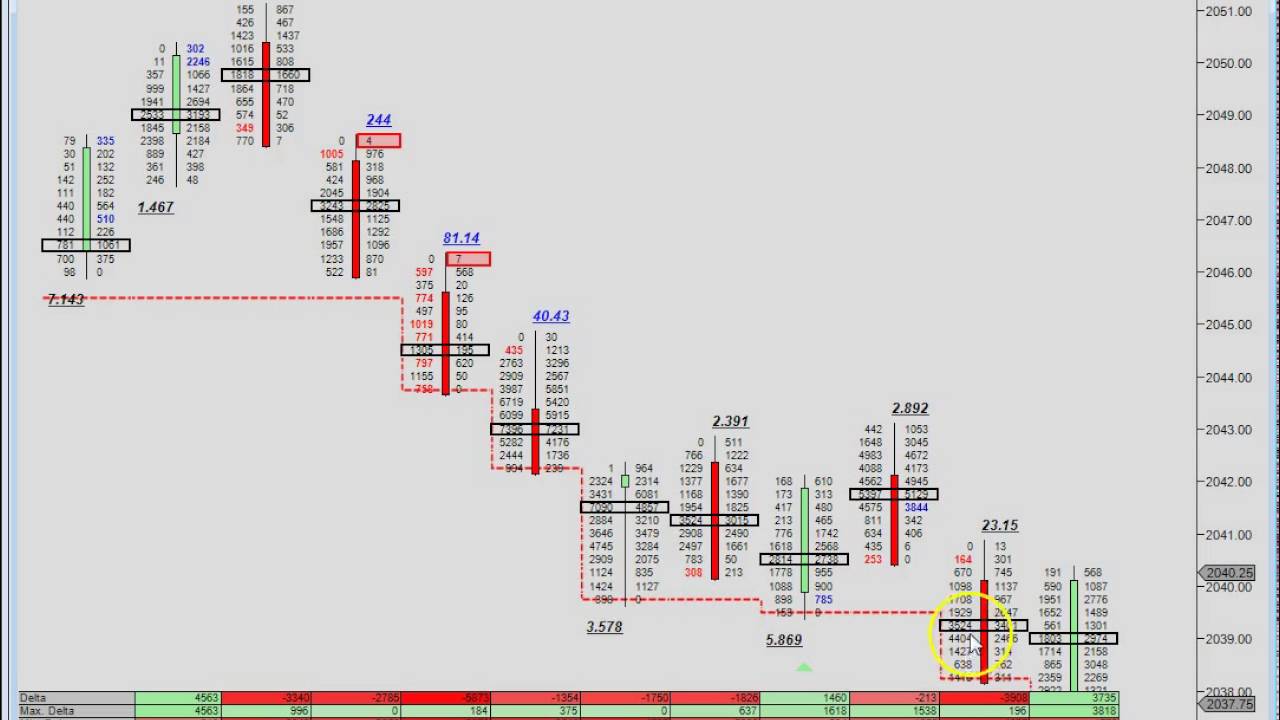
Order flow reveals the forces of supply and demand in real-time, which are the primary drivers of price action. Traditional price charts only show historical data, such as open, high, low, and close prices for each period, but they do not give any insight into the intentions of market participants. In contrast, order flow shows how many orders are pending at various price levels (through tools like the price ladder) and how many have actually been executed. This information can help traders identify areas of high liquidity, support, resistance, and even potential breakouts or reversals.
Key Concepts in Order Flow
Before diving into how day and swing traders can leverage order flow, it’s essential to understand a few key concepts:
- Bid and Ask: The bid represents the price buyers are willing to pay, while the ask is the price sellers are willing to accept. The difference between the two is the spread.
- Market Orders vs. Limit Orders: Market orders are executed immediately at the best available price, while limit orders are placed at a specific price level, waiting to be executed when the market reaches that level.
- Liquidity: This refers to how easily an asset can be bought or sold without affecting its price. High liquidity means there are many orders on both the bid and ask sides, leading to smaller price swings, while low liquidity can cause more significant price movements.
- Time and Sales: This is a tool that shows the actual trades as they happen in real time, displaying the size, price, and time of each trade. It helps traders gauge the urgency of buying or selling.
How Day Traders Can Use Order Flow to Maximize Profits
For day traders, who focus on short-term trades that last minutes or hours, order flow is an invaluable tool. Since day trading involves capitalizing on small price movements, having a deep understanding of market activity is crucial for timing entries and exits accurately.
1. Identifying Real-Time Supply and Demand Levels
The first way day traders can use order flow is by identifying supply and demand imbalances. For example, if you see a large number of buy orders at a certain price level (via the price ladder), it can indicate strong demand at that price, which might act as support. Conversely, a large cluster of sell orders can indicate resistance. By identifying these levels, traders can enter or exit trades at optimal points, avoiding false breakouts or failed trades.
For instance, if a stock is moving toward a known resistance level, and the order flow shows a sudden surge of buy orders, a trader might anticipate that the stock will break through the resistance, signaling a strong bullish move. On the other hand, if the buy orders fade as the stock nears resistance, it may signal that the stock will reverse, allowing the trader to profit from a short position.
2. Spotting Aggressive Buyers and Sellers
Order flow also allows traders to see the behavior of aggressive buyers or sellers. Aggressive traders use market orders to execute immediately, showing strong conviction in their trades. By tracking aggressive buying or selling in the order flow, a day trader can anticipate the direction of short-term price movements.
For example, if there is a series of large buy market orders hitting the ask price, it might indicate that institutional investors or large traders are pushing the stock higher. A day trader could ride this momentum by entering a long position early and exiting as soon as the momentum starts to fade, maximizing profits from the short-term uptrend.
3. Avoiding Spoofing and Manipulation
Day traders can also use order flow to avoid falling victim to market manipulation tactics like spoofing. Spoofing occurs when traders place large orders to create the illusion of supply or demand, only to cancel the orders before they’re executed. By monitoring the Time and Sales data in conjunction with the order book, traders can identify whether large orders are actually being executed or are just an attempt to deceive other participants.
How Swing Traders Can Use Order Flow to Maximize Profits
Swing traders, who hold positions for days or even weeks, can also benefit from using order flow, although their strategies differ from those of day traders. Since swing trading involves riding trends over a more extended period, order flow can help identify key turning points and major shifts in market sentiment.
1. Confirming Trend Reversals
Swing traders typically rely on technical analysis to identify potential trend reversals. Order flow can serve as a confirmation tool for these reversals. For example, if a swing trader identifies a possible reversal on a chart (such as a stock bouncing off a support level), the trader can look at the order flow to see if there is an influx of buy orders at that price level. If there is strong buying activity, it could confirm that the reversal is likely to occur, prompting the swing trader to enter a long position.
Conversely, if a stock is approaching resistance and the order flow shows a significant drop in buying interest, it could signal that the upward trend is losing strength. The swing trader could take this as a cue to exit a long position or enter a short position to profit from the upcoming downtrend.
2. Entering at Optimal Price Levels
Swing traders often aim to enter a trade at the best possible price to maximize potential profits over several days or weeks. By using order flow, they can spot liquidity clusters — areas where large orders are sitting. These areas can act as magnets for price, meaning that the stock is likely to gravitate toward those levels before continuing its trend. By placing limit orders near these liquidity clusters, swing traders can improve their entry prices, increasing the profit potential of the trade.
3. Tracking Institutional Activity
One of the most significant advantages of using order flow for swing traders is the ability to track institutional activity. Large institutional investors, such as hedge funds or mutual funds, often leave traces in the order flow due to the size of their trades. Swing traders can capitalize on this information by aligning their trades with institutional moves. If order flow shows a series of large buy orders over several trading sessions, it could indicate that institutions are accumulating shares, signaling a longer-term bullish trend. Swing traders can use this information to enter trades early and ride the trend over several days or weeks.
Conclusion
Order flow provides a real-time window into the market’s supply and demand dynamics, offering insights far beyond what traditional price charts can reveal. Day traders can use order flow to time their entries and exits with precision, identify momentum shifts, and avoid manipulation tactics. Swing traders, on the other hand, can use order flow to confirm trend reversals, improve their entry prices, and track institutional activity to profit from longer-term trends.
By incorporating order flow into their trading strategies, both day and swing traders can gain a competitive edge, making more informed decisions that can lead to higher profits. Whether it’s spotting aggressive buyers and sellers, identifying liquidity clusters, or confirming trend reversals, understanding order flow is a critical skill for traders looking to thrive in today’s fast-moving markets.
