Above the Green Line -01
  • Market Insights
        • Commentary
          • Daily
          • Weekly
        • BUY / SELL SIGNALS
          • Trade Posts
          • Recent Trade Alerts
          • Recent Day Trades
        • BLOGROLL
          • Dividend Growth Blog
          • ETF Sector Blog
          • Dow Dogs
          • TPOW Blog
  • Strategies
        • SWING TRADING
          • Current Positions
          • Watchlists
          • Closed Positions
          • Candidates - TOP 100
          • Specialty Stocks
        • WEEKLY STOCK PICK
          • TPOW Charts
          • TPOW Performance
          • TPOW Strategy Guide
          • TPOW Performance Dashboard
        • DAY TRADING
          • Watch List
        • ATGL DASHBOARD
        • ETF STRATEGIES
          • ETF Sector Rotation
          • ETF Sector Portfolio
        • DIVIDEND GROWTH
          • Dividend Growth Portfolio
          • Dividend Calendar
        • DOGS OF THE DOW
          • Dogs of the Dow Portfolio
          • DOW 5 Portfolio
  • Markets
        • US MARKET
          • Commodities
          • Energy
          • Precious Metals
          • Volatility
        • GLOBAL MARKETS
          • Market Indices
          • Economic Calendar
          • FOREX Heat Map
          • FOREX Cross Rates
          • Crypto Currency Market
  • Investing
    • Discord Community
    • Dashboard
  • Resources
        • ARTICLES
          • Dividend Growth Model Articles
          • ETF Articles
          • Investment Strategies Articles
          • Market and Economic Insights
          • Stock Trade Articles
          • Stock Reviews
        • TOOLS
          • Stock Scanners
          • Charting Software
          • Brokerage Firms
        • STOCK CHARTS
          • Key Components
          • Reading Charts
          • Drawing Stock Charts
          • Identifying Trends
        • RETIREMENT PLANNING
  • About
    • Contact Us
    • How to Win
    • #1 At Stockcharts
    • Disclaimer
    • FAQ
  • Log In
  • Subscribe

September 27, 2022

Money Wave Alert! Sep 27, 2022

SPX Chart
The S&P 500 Index is back down to the June Support.

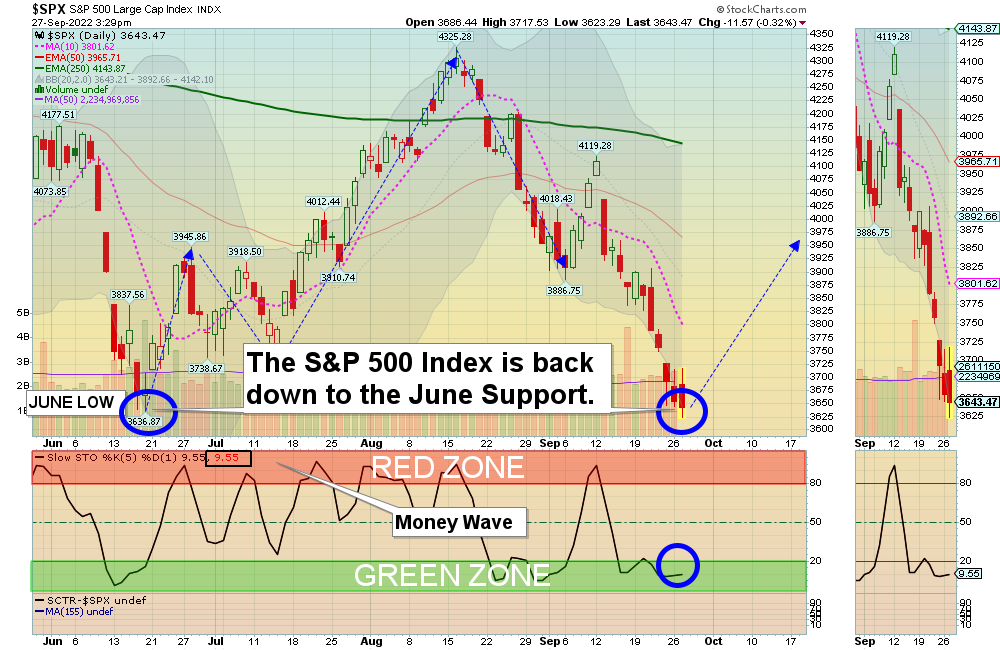
Markets gapped up in the morning but then reversed downward. Some of the Indices went below the June lows, but heavy Selling did not come in on the break of Support. This could be a “False Break Down”, where they Run the Stops just below the previous low to flush out the weak hands that don’t know where the Green Line is.

The US Dollar and long Term Interest Rates were higher again, hurting some stocks. But the Dollar and Interest Rates should be having having a Buying Climaxes and should peak soon (Way Above the Green Lines). Smart Money is not Buying much until these peak. Most will WAIT for a Money Wave Buy on the SPX Chart above.

FEAR is very high now, and that is when we like to Buy. Markets are currently about as over-sold as they ever get. The Indices are back down to the June lows (Support), where they bounced up 19 % from being over-sold on FEAR. We are lowering the Sell Stops and not Selling anything down here. Smart Money sold up in the Red Zone in August, and should be Buying soon near Support and in the Green Zone.

Please be patient and wait for Buy Signals for Securities that are still Above the Green Lines.  BUYS SOON – CHARTS  The best moves are when the S&P 500 Index is also coming up out of the Green Zone (very soon).  

_________________________________________________________________________________________________________________

BUYS TODAY   9/27/02022     NONE TODAY

BUYS TOMORROW 

CPRX      CATALYST PHARMA.      Low Volume today. Buy above the Pink Line of $12.94 with High Volume with a 5% Trailing Sell Stop Loss below it.

GERN      GERON CORP.      Wait for Money Wave Close > 20 with High Volume. 

UNG      US NAT’L. GAS FUND      Wait for Money Wave Close > 20 with High Volume. 

Shop for a better price earlier in the day with Triple Buy Signal, on the same day that a Daily Money Wave Buy Signal will occur.  

BUYS SOON     

ENVX      ENOVIX CORP.    Wait for Money Wave Close > 20 with High Volume.

SIGA      SIGA TECH.      Wait for Money Wave Close > 20 with High Volume.      

XOM      EXXON MOBILE CORP.     Wait for Money Wave Close > 20 with High Volume.    

Please be patient and Wait for Money Wave Buy Signals.  We will email you when they are ready. Follow on the WATCH LIST.   

SELLS TODAY       

XLU      UTILITIES FUND      LOWER the Sell Stop Loss below $68.00 until it bottoms. 

__________________________________________________________________________________________________________

DAY TRADING SETUPS.  A few Triple Buy Pops today: AMC (+9%) LABU (+9%) (HUSA (+6%) & VIXY (+6%). ( Try out the New Side by Side layout.      

DAY TRADING FOR INDICES & LARGE CAPS CHARTS.

Bonds were down again today and are Way Below the Green Line.  

Crude Oil was up $2.08 today at $78.79.

MY TRADING DASHBOARD 
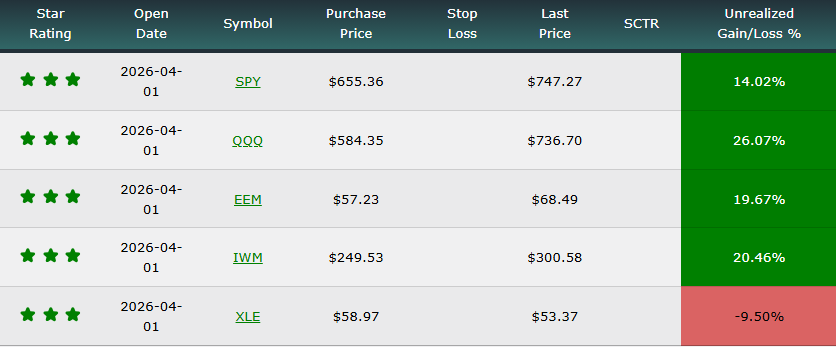
SWING TRADING CURRENT POSITIONS
DAY TRADING SETUPS
TRADE ALERTS
GREEN LINE CHARTS AT STOCKCHARTS
ARE YOUR INVESTMENTS ABOVE THE GREEN LINE?
GREEN LINE RULES
ETF SECTOR ROTATION SYSTEM   
New TOP 100 LIST Updated Sep 1, 2022

Many like to Buy the Swing Trades just before the Close, if the Money Wave is going to create a Buy Signal (Closing > 20 and up out of the Green Zone). Don’t Buy if the Security has already popped up too much. Money Wave Buy Signals are usually good for a 3-6 % move in a few days.

We will “Not Log” trades if the Reward/Risk is not at least 2:1, or Low Volume. These have more risk.   

Related Post

– CPRX

Subscribe to Our Newsletter

AGL Logo

Get our eBook Now!

Candlestick - A Swing Traders Friend

We don’t spam! Read our privacy policy for more info.

You’ve been successfully subscribed to our newsletter!

Voted #1 at Stock Charts

SH Chart
Inverse S&P 500 Fund (SH) will have a Money Wave Buy today.

Help Us Help Animals

Help Us Help Animals

Recent Comments

  • Market Breadth Indicators: A Trader’s Guide to Early Trend Detection on Backtesting: Definition and How a Trading Strategy Backtest Works
  • Island Reversal Pattern: Definition and Formation Explained on Double Top Pattern: How to Identify and Trade This Reversal Signal
  • Channel Pattern Guide: What It Is and Why It Matters on A Guide to Forecasting Using Moving Averages
  • What Is a Broadening Bottom Chart Pattern? Full Guide on Bull vs. Bear Market: An Investor’s Guide to Market Phases
  • ATGL Weekly Money Flow - 2025-05-11 on ATGL Top Pick of the Week! Apr 6, 2025

Become a Green Liner!

Help me make more Money in the Stock Market.

ON ATGL

  • DashBoard
  • Weekly Commentary
  • Daily Buy / Sell Signals
  • Day Trade Setup
  • Trading Rooms

Design & Develop By Pixelvect

STRATEGIES

  • Swing Trading
  • ATGL Pick of the Week
  • Dividend Growth
  • ETF Sector Rotation
  • Dogs of the Dow

HELP

  • ATGL Trading Rules
  • FAQ
  • Account Maintenance
  • Contact US
  • Join

FOLLOW US

Instagram Linkedin Twitter Facebook

© COPYRIGHT 2024 · ABOVETHEGREENLINE.COM · ALL RIGHTS RESERVED · PRIVACY · TERMS · CONTACT · WATCHLIST · CURRENT