Above the Green Line -01
  • Market Insights
        • Commentary
          • Daily
          • Weekly
        • BUY / SELL SIGNALS
          • Trade Posts
          • Recent Trade Alerts
          • Recent Day Trades
        • BLOGROLL
          • Dividend Growth Blog
          • ETF Sector Blog
          • Dow Dogs
          • TPOW Blog
  • Strategies
        • SWING TRADING
          • Current Positions
          • Watchlists
          • Closed Positions
          • Candidates - TOP 100
          • Specialty Stocks
        • WEEKLY STOCK PICK
          • TPOW Charts
          • TPOW Performance
          • TPOW Strategy Guide
          • TPOW Performance Dashboard
        • DAY TRADING
          • Watch List
        • ATGL DASHBOARD
        • ETF STRATEGIES
          • ETF Sector Rotation
          • ETF Sector Portfolio
        • DIVIDEND GROWTH
          • Dividend Growth Portfolio
          • Dividend Calendar
        • DOGS OF THE DOW
          • Dogs of the Dow Portfolio
          • DOW 5 Portfolio
  • Markets
        • US MARKET
          • Commodities
          • Energy
          • Precious Metals
          • Volatility
        • GLOBAL MARKETS
          • Market Indices
          • Economic Calendar
          • FOREX Heat Map
          • FOREX Cross Rates
          • Crypto Currency Market
  • Investing
    • Discord Community
    • Dashboard
  • Resources
        • ARTICLES
          • Dividend Growth Model Articles
          • ETF Articles
          • Investment Strategies Articles
          • Market and Economic Insights
          • Stock Trade Articles
          • Stock Reviews
        • TOOLS
          • Stock Scanners
          • Charting Software
          • Brokerage Firms
        • STOCK CHARTS
          • Key Components
          • Reading Charts
          • Drawing Stock Charts
          • Identifying Trends
        • RETIREMENT PLANNING
  • About
    • Contact Us
    • How to Win
    • #1 At Stockcharts
    • Disclaimer
    • FAQ
  • Log In
  • Subscribe

September 10, 2020

Money Wave Alert! Sep 10, 2020

SPX 60 Chart
The S&P 500 Index is re-testing Tuesday’s Lows.

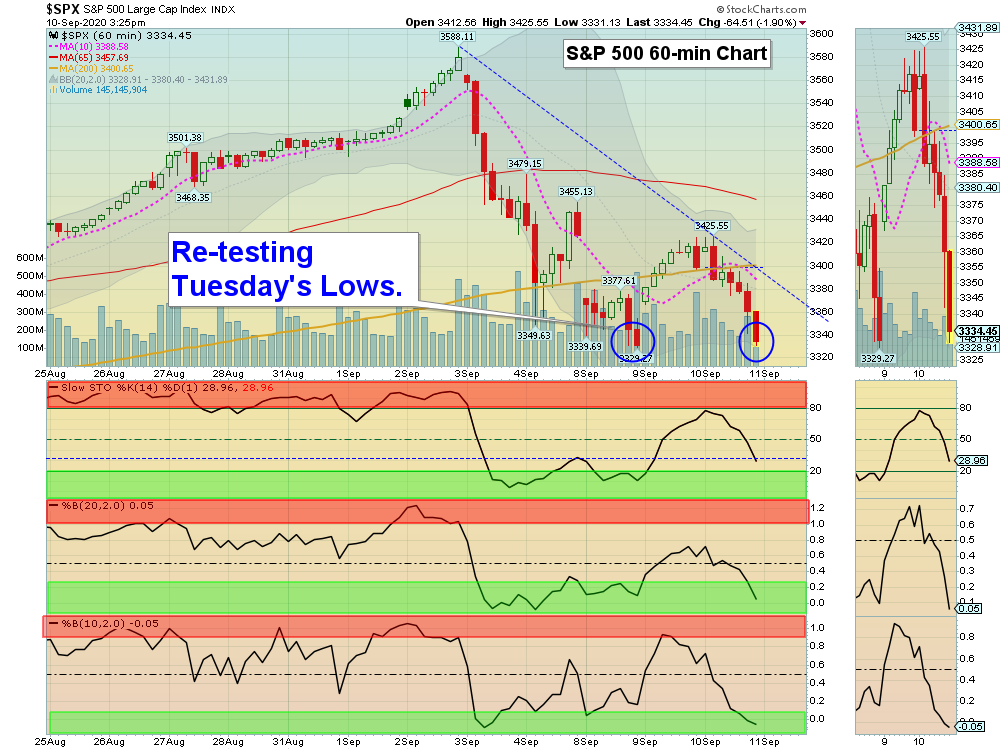
Markets were down today as the Indices needed to re-test the recent Lows on Tuesday. A Double Bottom or “W” pattern soon would be Bullish. Try to Buy only the very Strongest Leaders that did not fall below their Red Lines (50-day avgs.) for the fastest bounces. The Markets have drop back down and Support should be around the Red Lines (3323 on the S&P 500 Index).

Buy the Leaders below when they pop up out of the Green Zones for Money Wave Buy Signals soon. The better trades happen when the S&P 500 Index is also in the Green Zone. (The S&P 500 today is coming up out of the Green Zone).

Please remember that the Markets are up 53 % from the March Lows, and are over-bought from extreme Confidence and Hope. 

Bonds  were up today. 

Crude Oil was down $0.92 today at $37.13.

BUYS TODAY    9/10/2020   

HOME     AT HOME GROUP      Bought today above $15.87 with a 5% Trailing Sell Stop Loss. HOME shot up 12.7% to $17.59 and was stopped out for a 4% Gain. (5% below the High of $17.59, or at $16.53).    

W      WAYFAIR INC.      Bought today above $272 (at $272.60) with a 5% Trailing Sell Stop Loss. W shot up 14.9% to $296.86 and was stopped out at $275.10.


ADT       ADT INC.      Bought today above the Pink Line of $10.71, but the Volume is very Low. This trade will not be logged. Target is $12.50. EXIT if it is going to Close below $10.42.

OSTK      OVERSTOCK.COM      Money Wave Buy today. OSTK will not be logged as it is already up 10 % today.

We will “Not Log” trades if the Reward/Risk is not at least 2:1.   

JUMP START: (Buy Signal should be very soon… Click on the Jump Start link for more info.) 

KODK      EASTMAN KODAK      Buy above $6.23 with a 5% Trailing Sell Stop Loss below it.     

SMH      SEMICONDUCTOR FUND     

TSLA      TESLA INC.

XLK      TECH FUND

____________________________________________________________________________________________________________________________________________________  

WATCH LIST

Money Wave Buys Signals Soon (3 Days-3 Weeks Short Term):   (Best to Buy these when the S&P 500 is also in the Green Zone.)       

The Following Investments will probably have a Money Wave Buy Signal soon. (Slow Stochastic Closing > 20) on today’s Close.                  

DOCU      DOCUSIGN CORP.     

FB      FACEBOOK INC.

KODK      EASTMAN KODAK      Buy above $6.23 with a 5% Trailing Sell Stop Loss below it.     

PBI      PITNEY BOWES INC.

PLUG     PLUG POWER INC.      Money Wave must Close in the Green Zone.     

PRTS      CAR PARTS.COM      Buy above $10.85 with a 5% Trailing Sell Stop Loss below it. 

VXRT     VAXART INC.      Buy above the Pink Line of $5.39 with a 5% Trailing Sell Stop Loss below it. (2nd Buy Signal soon).   

Please be patient and wait for Money Wave Buy Signals.  We will email you when they are ready. Follow on the WATCH LIST.

Emotions are very high now, so please do not Buy unless you are VERY NIMBLE.

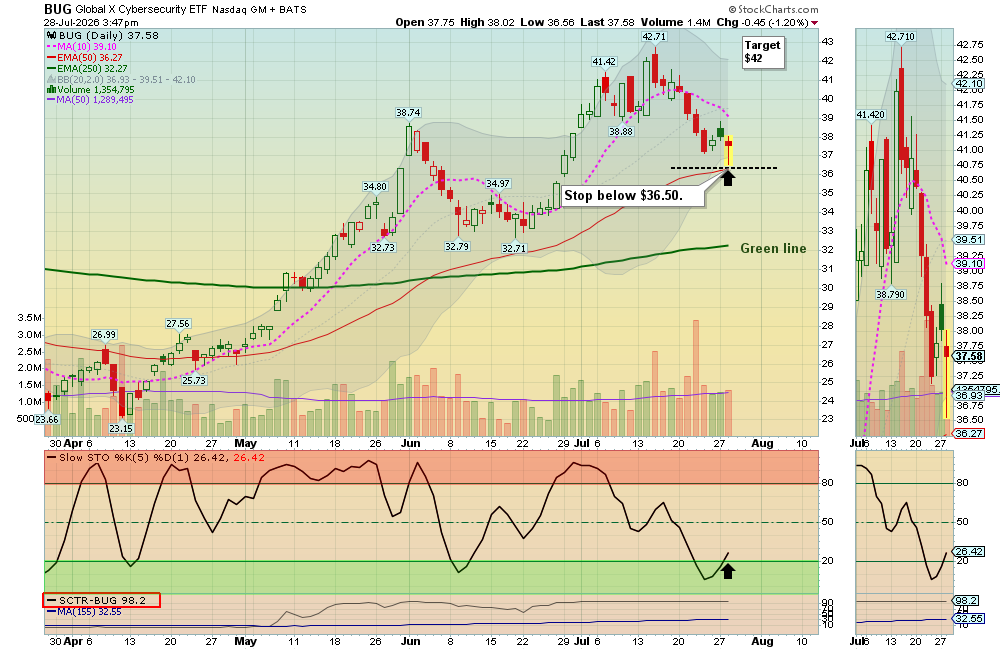
The Leaders are Way Above the Green Lines (all Investments eventually return to their Green Lines).

___________________________________________________________________________________________________

SELLS TODAY   

FLDM      FLUIDIGM CORP.      Shot up 10.9% this morning and was Stopped Out for a 5.2% Gain. (5% below the High of $6.92, or at $6.56). 

WTRH      WAITR HOLDINGS      Shot up 26% today and and was Stopped Out at the Buy Price (Don’t Take a Loss!)

Click for  CURRENT POSITIONS  and adjust your Sell Stops.   
Click for  CLOSED POSITIONS,   

NEW PENNY STOCK WATCH LIST
ARE YOUR INVESTMENTS ABOVE THE GREEN LINE?
ETF SECTOR ROTATION SYSTEM   
NEW TOP 100 LIST Updated Sep 2, 2020

Many like to Buy the day before, near the Close, if the Money Wave is going to create a Buy Signal (Closing > 20 and out of the Green Zone).

Don’t Buy if the Investment has already popped up too much. Money Wave Buys are usually good for a 3-6 %  move in a few days.

We will “Not Log” trades if the Reward/Risk is not at least 2:1.   

Related Post

– Money Wave Alert! Sep 9, 2020

Subscribe to Our Newsletter

AGL Logo

Get our eBook Now!

Candlestick - A Swing Traders Friend

We don’t spam! Read our privacy policy for more info.

You’ve been successfully subscribed to our newsletter!

Voted #1 at Stock Charts

SH Chart
Inverse S&P 500 Fund (SH) will have a Money Wave Buy today.

Help Us Help Animals

Help Us Help Animals

Recent Comments

  • Market Breadth Indicators: A Trader’s Guide to Early Trend Detection on Backtesting: Definition and How a Trading Strategy Backtest Works
  • Island Reversal Pattern: Definition and Formation Explained on Double Top Pattern: How to Identify and Trade This Reversal Signal
  • Channel Pattern Guide: What It Is and Why It Matters on A Guide to Forecasting Using Moving Averages
  • What Is a Broadening Bottom Chart Pattern? Full Guide on Bull vs. Bear Market: An Investor’s Guide to Market Phases
  • ATGL Weekly Money Flow - 2025-05-11 on ATGL Top Pick of the Week! Apr 6, 2025

Become a Green Liner!

Help me make more Money in the Stock Market.

ON ATGL

  • DashBoard
  • Weekly Commentary
  • Daily Buy / Sell Signals
  • Day Trade Setup
  • Trading Rooms

Design & Develop By Pixelvect

STRATEGIES

  • Swing Trading
  • ATGL Pick of the Week
  • Dividend Growth
  • ETF Sector Rotation
  • Dogs of the Dow

HELP

  • ATGL Trading Rules
  • FAQ
  • Account Maintenance
  • Contact US
  • Join

FOLLOW US

Instagram Linkedin Twitter Facebook

© COPYRIGHT 2024 · ABOVETHEGREENLINE.COM · ALL RIGHTS RESERVED · PRIVACY · TERMS · CONTACT · WATCHLIST · CURRENT