
Watch List and Charts to Buy Soon.
| Daily Swing Watch List to Buy | Daily Swing Charts to Buy |
| Current Daily Swing Positions | Current Swing Charts |
| Closed Daily Swing Results | Trading Dashboard |
Current Pick and Chart
| Top Pick of the Week | TPOW Stock Chart |
The Top Pick of the Week: SoFi Technologies Inc. $SOFI was already sold on Monday for a solid 4% gain (Conservative Target).
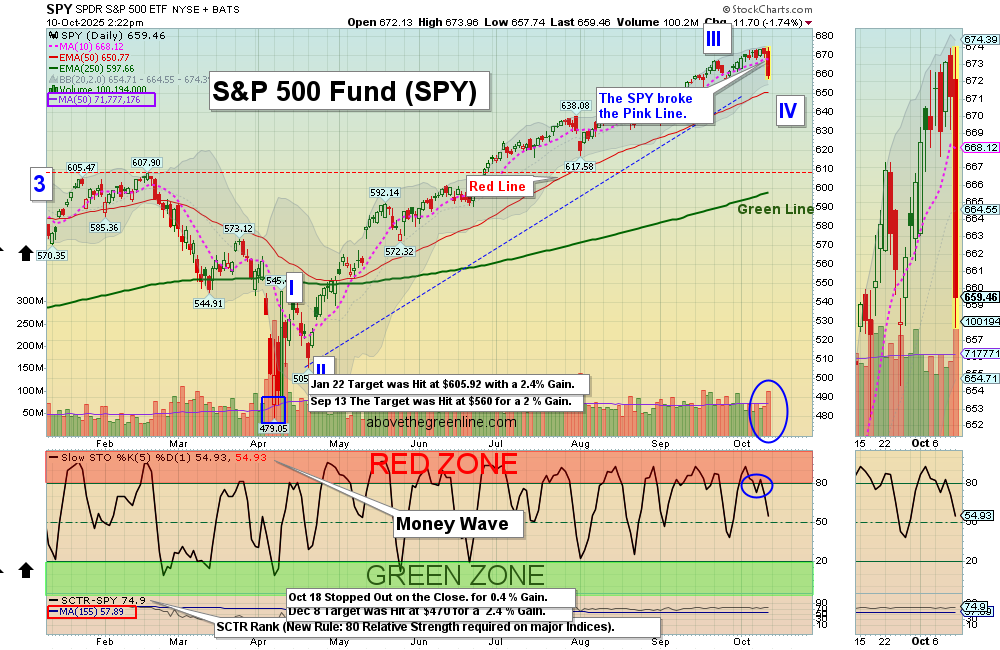
Oct 10, 2025 Today, the markets opened on a bearish note as SPY moved to the downside after forming a clear M pattern, signaling exhaustion after an overextended rally. Across the board, similar M patterns appeared, and prices started retracing toward their banana lines, marking a much-needed correction. Inverse funds like SH and RWM popped upward toward their mean values, while the Fear Index VIX surged over 30%, and Bonds (TLT) spiked higher—both indicating weakness in the overall economy. We will not Stop Out of any Swing Trades today on this mild Flush.
Despite the market’s decline, we secured solid gains this week, including another 4% profit on TPOW, showing consistent strength in our trades. We remain cautious and patiently wait for this correction to settle, as the best swing opportunities will emerge once large caps like SPY reach their daily green zone; overall, today was a very weak and bearish session and markets retracing toward their Mean value The banana line.
Wait for more Buy Signals coming up out of the Green Zones. WATCH LIST CHARTS
The best moves happen when the S&P 500 Index is also coming up out of the Green Zone.
______________________________________________________________________________
BUYS TODAY 10/10/2025 NONE TODAY
BUYS SOON
| Open Date | Symbol | Description | Industry | SCTR | Size | Last Price | Daily Change % | ATGL 60 Min | Comments | id | Strategy | Position | Sell Date | Sell Price | Purchase Price | Net Profit | Realized Gain/Loss % | ATGL Rule | Stop Loss | color | Chart | Update Date | Status | Unrealized Gain/Loss % | Volume | Post Type | # Shares | Amount Invested | Portfolio Weight | Dividend Rate | Current Yield | Current Value | Yield on Cost | Projected Annual Dividends | Total Dividends Received | Pay Back | Profit / Loss | Annualized Profit/Loss | Star Rating | Target Price | News Alert % | Target Triggered |
|---|---|---|---|---|---|---|---|---|---|---|---|---|---|---|---|---|---|---|---|---|---|---|---|---|---|---|---|---|---|---|---|---|---|---|---|---|---|---|---|---|---|---|
| 2026-06-18 | APPS | Digital Turbine Inc. | Software | 96 | Small | $8.92 | 3.5424 | Wait for next Daily Money Wave Close > 20 with High Volume. | 5093 | Short Term | Long | $0.00 | 0.00% | https://stockcharts.com/sc3/ui/?s=APPS&a=2293191731&p=D&yr=0&mn=4&dy=0&id=p58001660323 | 2026-06-21 19:13:01 | open | 0.00% | 1832365 | Watch List | $0 | 0.00% | 0.00 | 0 | $0 | 0.00% | $0 | $0 | 0.00% | 0.00% | - | $10.00 | |||||||||||
| 2026-06-17 | RXO | RXO Inc. | Transport | 92 | Small | $25.81 | 1.6542 | Wait for next Daily Money Wave Close > 20 with High Volume. | 5091 | Short Term | Long | $0.00 | 0.00% | https://stockcharts.com/sc3/ui/?s=RXO&a=2292341458&p=D&yr=0&mn=4&dy=0&id=p19522285398 | 2026-06-17 19:11:32 | open | 0.00% | 143746 | Watch List | $0 | 0.00% | 0.00 | 0 | $0 | 0.00% | $0 | $0 | 0.00% | 0.00% | - | $28.50 | |||||||||||
| 2026-06-16 | BAND | Bandwidth Inc. | Telecom | 98 | Small | $49.44 | -3.7945 | Wait for next Daily Money Wave Close > 20 with High Volume. | 5090 | Short Term | Long | $0.00 | 0.00% | https://stockcharts.com/sc3/ui/?s=BAND&a=2291301469&p=D&yr=0&mn=4&dy=0&id=p58001660323 | 2026-06-16 16:30:16 | open | 0.00% | 345501 | Watch List | $0 | 0.00% | 0.00 | 0 | $0 | 0.00% | $0 | $0 | 0.00% | 0.00% | - | $67.50 | |||||||||||
| 2026-06-14 | RDW | Redwire Corp. | AeroSpace | 94 | Small | $13.13 | -8.5017 | Wait for next Daily Money Wave Close > 20 with High Volume. | 5087 | Short Term | Long | $0.00 | 0.00% | https://stockcharts.com/sc3/ui/?s=RDW&a=2281132577&p=D&yr=0&mn=4&dy=0&id=p21116263806 | 2026-06-14 19:16:51 | open | 0.00% | 18365338 | Watch List | $0 | 0.00% | 0.00 | 0 | $0 | 0.00% | $0 | $0 | 0.00% | 0.00% | - | $21.00 |
Shop for a better price earlier in the day with Green Candle Buy Signal, on the same day that a Daily Money Wave Buy Signal will occur.
Many like to Buy the Swing Trades just before the Close, if the Money Wave is going to create a Buy Signal (Closing > 20 and up out of the Green Zone). Don’t Buy if the Security has already popped up too much. Money Wave Buy Signals are usually good for a 3-6 % move in a few days.
SELLS TODAY NONE TODAY
________________________________________________________________________
WEEKLY SWING TRADE POPS None Today
WEEKLY SWING TRADING (Formerly LONG TERM)Watch List and Charts to Buy Soon.
| Weekly Swing Watch List to Buy | Weekly Swing Charts to Buy |
| Current Weekly Positions | Current Weekly Charts |
| Closed Weekly Swing Trades | Stage Chart Investing |
DAY TRADING SETUPS. Today we had 24 scalp trades for nice Gains at our Trading Room. In this Emotional Market now, Day Trading Alerts are not being sent out on our Discord Site with Live Chatting. Please install Discord app on your PC or cell for mobile notifications. Check out our Live Stream.
Or look for Green Candle Buy Pops (Red Candle turns Green). Big Movers today: APLD+30% SOXS +15% & YANG +17%
Bonds were up today and are Above the Green Line.
Crude Oil was down $2.65 today at $58.85.
MY TRADING DASHBOARD
SWING TRADING CURRENT POSITIONS
DAY TRADING SETUPS
TRADE ALERTS
STAGE CHART INVESTING
PREVIOUS GREEN LINE STOCKS
HAVE A NICE WEEKEND!
