Above the Green Line -01
  • Market Insights
        • Commentary
          • Daily
          • Weekly
        • BUY / SELL SIGNALS
          • Trade Posts
          • Recent Trade Alerts
          • Recent Day Trades
        • BLOGROLL
          • Dividend Growth Blog
          • ETF Sector Blog
          • Dow Dogs
          • TPOW Blog
  • Strategies
        • SWING TRADING
          • Current Positions
          • Watchlists
          • Closed Positions
          • Candidates - TOP 100
          • Specialty Stocks
        • WEEKLY STOCK PICK
          • TPOW Charts
          • TPOW Performance
          • TPOW Strategy Guide
          • TPOW Performance Dashboard
        • DAY TRADING
          • Watch List
        • ATGL DASHBOARD
        • ETF STRATEGIES
          • ETF Sector Rotation
          • ETF Sector Portfolio
        • DIVIDEND GROWTH
          • Dividend Growth Portfolio
          • Dividend Calendar
        • DOGS OF THE DOW
          • Dogs of the Dow Portfolio
          • DOW 5 Portfolio
  • Markets
        • US MARKET
          • Commodities
          • Energy
          • Precious Metals
          • Volatility
        • GLOBAL MARKETS
          • Market Indices
          • Economic Calendar
          • FOREX Heat Map
          • FOREX Cross Rates
          • Crypto Currency Market
  • Investing
    • Discord Community
    • Dashboard
  • Resources
        • ARTICLES
          • Dividend Growth Model Articles
          • ETF Articles
          • Investment Strategies Articles
          • Market and Economic Insights
          • Stock Trade Articles
          • Stock Reviews
        • TOOLS
          • Stock Scanners
          • Charting Software
          • Brokerage Firms
        • STOCK CHARTS
          • Key Components
          • Reading Charts
          • Drawing Stock Charts
          • Identifying Trends
        • RETIREMENT PLANNING
  • About
    • Contact Us
    • How to Win
    • #1 At Stockcharts
    • Disclaimer
    • FAQ
  • Log In
  • Subscribe

November 5, 2021

Money Wave Alert! Nov 5, 2021

SPX Chart
The S&P 500 Index should be about to complete Wave 3 up, since the Nov. lows.

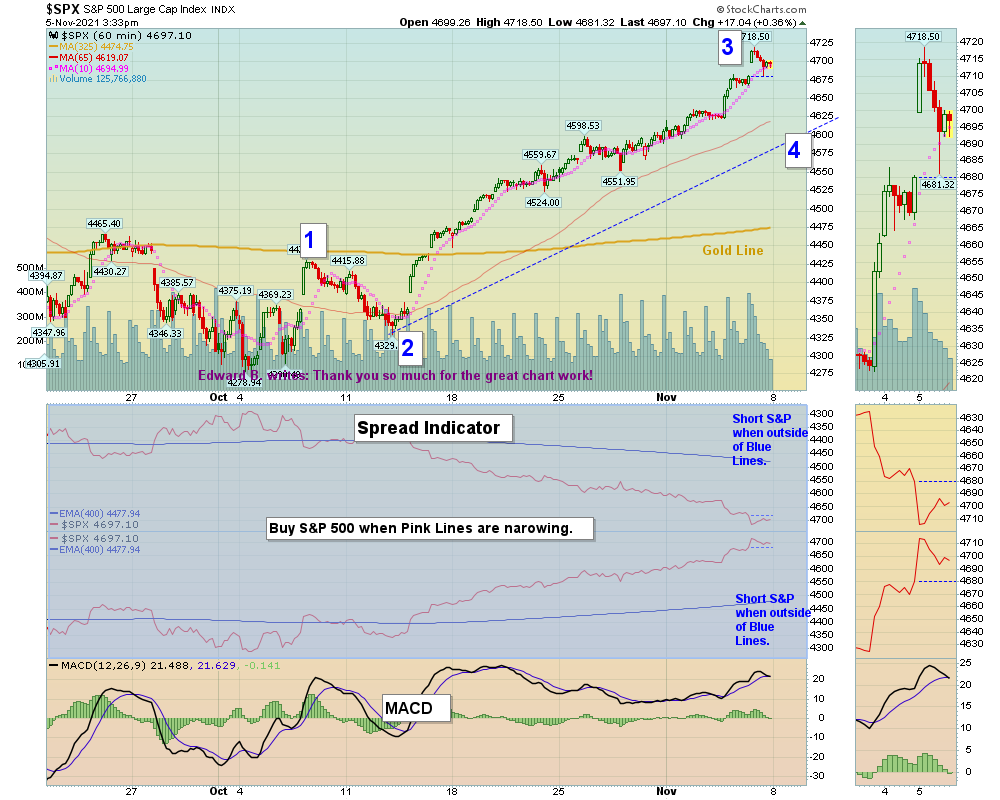
Markets were higher today on continued buying from good Earnings. Some of the Tech and Semiconductor stocks had some profit taking after yesterday’s surge up. This might be near the end of Wave 3 up since the Sep. lows. Then normally a mild Wave 4 pull-back. The Buying Volume was not good and many of the Leaders are back up in the Red Zones (probably too late to Buy for the Short Term).

New Investors:  Leaders are back up in the Red Zones. Please WAIT for the Leaders to correct back down into the Green Zones for more Money Wave Buys. It does not take that long. The better trades happen when the S&P 500 Index is in the Green Zone.  

Today was slower for Triple Buys: AMC (+4%) BBIG (+4%) DATS & HX (+9%). Soon for ANY BKKT BTBT CIDM DWAC MARK OCGN PHUN & SBEA in DAY TRADING SETUPS.  Try out the New Side by Side layout.

Bonds  were up today, and are back Above the Green Line..

Crude Oil was up $2.77 today at $81.58.

BUYS TODAY    11/05/2021    NONE TODAY       

_________________________________________________________________________________________________

JUMP START SCROLLING CHARTS: (Buy with High Volume).   

OCGN      OCUGEN INC.      Wait for Money Wave Close > 20 with High Volume. 

_________________________________________________________________________________________________

WATCH LIST (Click here)       

WATCH LIST SCROLLING CHARTS (Real Time)

LI      LI AUTO INC.      Buy above the the Pink Line around $32.32 with High Volume with a 5% Trailing Sell Stop Loss below it.   

LPTX      LEAP THERA.   Buy above the Pink Line around $2.74 with High Volume with a 5% Trailing Sell Stop Loss below it.     

BGI      BIRKS GROUP INC.      Wait for Money Wave Close > 20 with High Volume.      

Please be patient and wait for Money Wave Buy Signals.  We will email you when they are ready. Follow on the WATCH LIST.      
Emotions are very high now, so please do not Buy unless you are VERY NIMBLE.

The Leaders are Way Above the Green Lines (all Investments eventually return to their Green Lines).      

____________________________________________________________________________________________________________

SELLS TODAY     

MARK      REMARK HOLDINGS      EXIT if it is going to Close below Support of $1.68.  This trade was not logged.


CLF      CLEVELAND CLIFFS STEEL      EXIT if it is going to Close below the Red Line of $22.38 in the Long Term Portfolio. The Target was already Hit for a 15.6 % Gain.     

CZR      CAESAR’S ENTERTAINMENT      EXIT if it is going to Close below the Red Line of $108.67 in the Long Term Portfolio. The Target was already Hit for a 16.1 % Gain.     

MY TRADING DASHBOARD
DAY TRADING SETUPS
NEW:  TRADE ALERTS
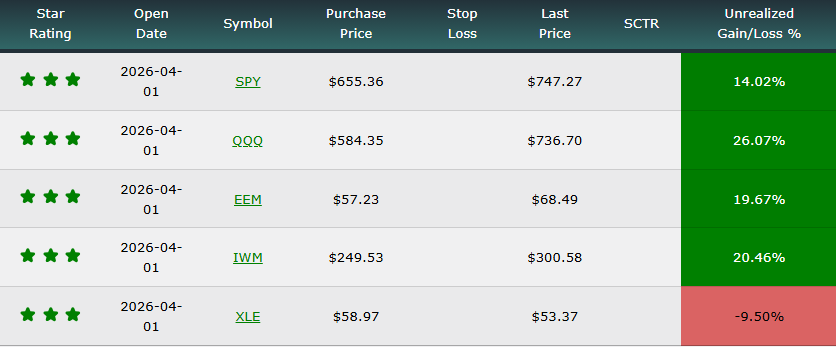
ARE YOUR INVESTMENTS ABOVE THE GREEN LINE?
ETF SECTOR ROTATION SYSTEM   
New TOP 100 LIST Updated Nov 2, 2021

Many like to Buy the day before, near the Close, if the Money Wave is going to create a Buy Signal (Closing > 20 and out of the Green Zone).

Don’t Buy if the Investment has already popped up too much. Money Wave Buys are usually good for a 3-6 %  move in a few days.

We will “Not Log” trades if the Reward/Risk is not at least 2:1, or Low Volume. These have more risk.   


HAVE A NICE WEEKEND!

Related Post

– Money Wave Alert! Nov 4, 2021

Subscribe to Our Newsletter

AGL Logo

Get our eBook Now!

Candlestick - A Swing Traders Friend

We don’t spam! Read our privacy policy for more info.

You’ve been successfully subscribed to our newsletter!

Voted #1 at Stock Charts

SH Chart
Inverse S&P 500 Fund (SH) will have a Money Wave Buy today.

Help Us Help Animals

Help Us Help Animals

Recent Comments

  • Market Breadth Indicators: A Trader’s Guide to Early Trend Detection on Backtesting: Definition and How a Trading Strategy Backtest Works
  • Island Reversal Pattern: Definition and Formation Explained on Double Top Pattern: How to Identify and Trade This Reversal Signal
  • Channel Pattern Guide: What It Is and Why It Matters on A Guide to Forecasting Using Moving Averages
  • What Is a Broadening Bottom Chart Pattern? Full Guide on Bull vs. Bear Market: An Investor’s Guide to Market Phases
  • ATGL Weekly Money Flow - 2025-05-11 on ATGL Top Pick of the Week! Apr 6, 2025

Become a Green Liner!

Help me make more Money in the Stock Market.

ON ATGL

  • DashBoard
  • Weekly Commentary
  • Daily Buy / Sell Signals
  • Day Trade Setup
  • Trading Rooms

Design & Develop By Pixelvect

STRATEGIES

  • Swing Trading
  • ATGL Pick of the Week
  • Dividend Growth
  • ETF Sector Rotation
  • Dogs of the Dow

HELP

  • ATGL Trading Rules
  • FAQ
  • Account Maintenance
  • Contact US
  • Join

FOLLOW US

Instagram Linkedin Twitter Facebook

© COPYRIGHT 2024 · ABOVETHEGREENLINE.COM · ALL RIGHTS RESERVED · PRIVACY · TERMS · CONTACT · WATCHLIST · CURRENT