Above the Green Line -01
  • Market Insights
        • Commentary
          • Daily
          • Weekly
        • BUY / SELL SIGNALS
          • Trade Posts
          • Recent Trade Alerts
          • Recent Day Trades
        • BLOGROLL
          • Dividend Growth Blog
          • ETF Sector Blog
          • Dow Dogs
          • TPOW Blog
  • Strategies
        • SWING TRADING
          • Current Positions
          • Watchlists
          • Closed Positions
          • Candidates - TOP 100
          • Specialty Stocks
        • WEEKLY STOCK PICK
          • TPOW Charts
          • TPOW Performance
          • TPOW Strategy Guide
          • TPOW Performance Dashboard
        • DAY TRADING
          • Watch List
        • ATGL DASHBOARD
        • ETF STRATEGIES
          • ETF Sector Rotation
          • ETF Sector Portfolio
        • DIVIDEND GROWTH
          • Dividend Growth Portfolio
          • Dividend Calendar
        • DOGS OF THE DOW
          • Dogs of the Dow Portfolio
          • DOW 5 Portfolio
  • Markets
        • US MARKET
          • Commodities
          • Energy
          • Precious Metals
          • Volatility
        • GLOBAL MARKETS
          • Market Indices
          • Economic Calendar
          • FOREX Heat Map
          • FOREX Cross Rates
          • Crypto Currency Market
  • Investing
    • Discord Community
    • Dashboard
  • Resources
        • ARTICLES
          • Dividend Growth Model Articles
          • ETF Articles
          • Investment Strategies Articles
          • Market and Economic Insights
          • Stock Trade Articles
          • Stock Reviews
        • TOOLS
          • Stock Scanners
          • Charting Software
          • Brokerage Firms
        • STOCK CHARTS
          • Key Components
          • Reading Charts
          • Drawing Stock Charts
          • Identifying Trends
        • RETIREMENT PLANNING
  • About
    • Contact Us
    • How to Win
    • #1 At Stockcharts
    • Disclaimer
    • FAQ
  • Log In
  • Subscribe

November 10, 2021

Money Wave Alert! Nov 10, 2021

SPY Chart
Maybe a Triple Buy Signal tomorrow on the S&P 500 Index.

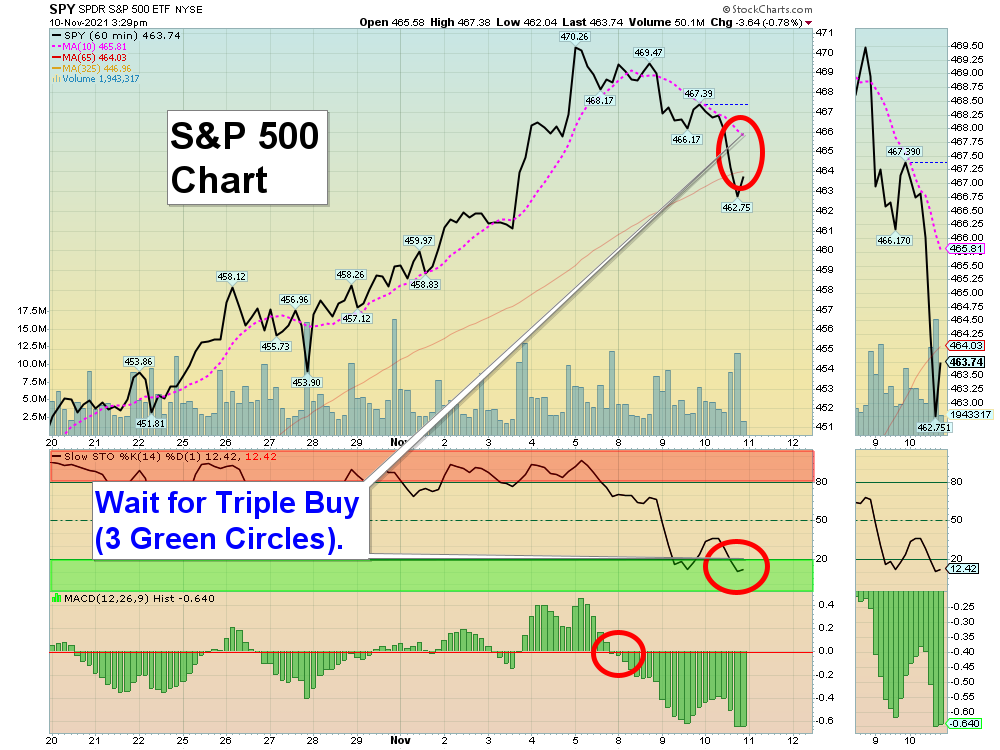
Markets were lower again today as the Indices went down to the Pink Lines (10-day avgs.) The Indices need to bounce up at the Pink Lines soon to avoid a Short Term Sell Signal. The very Strongest Leaders that are still above the Pink Lines like AMD LCID NVDA SMH & IWM should pop right back up and retest the recent Highs. Please be patient and Wait for more Green Zone Money Wave Buy Signals soon.

New Investors:  Leaders are coming down from Red Zones. Please WAIT for the Leaders to correct back down into the Green Zones for more Money Wave Buys. It does not take that long. The better trades happen when the S&P 500 Index is also in the Green Zone.  

A few Triple Buys today: DWAC (+5%) & MARK (+13%). Soon for AMC ANY BBIG BKKT DATS HUT LCID OCGN PHUN & TSLA in DAY TRADING SETUPS.  Try out the New Side by Side layout.

Bonds  were down today, but are back Above the Green Line..

Crude Oil was down $3.04 today at $81.11

BUYS TODAY    11/10/2021    NONE TODAY       

_________________________________________________________________________________________________

JUMP START SCROLLING CHARTS: (Buy with High Volume).   

BGI      BIRKS GROUP INC.      Wait for Money Wave Close > 20 with High Volume.

ENLC      ENLINK MIDSTREAM LLC      Buy above $7.49 with High Volume with a 5% Trailing Sell Stop Loss below it.     

OCGN      OCUGEN INC.      Wait for Money Wave Close > 20 with High Volume. 

TSLA      TESLA CORP.      Wait for Money Wave Close > 20 with High Volume.

_________________________________________________________________________________________________

WATCH LIST (Click here)       

WATCH LIST SCROLLING CHARTS (Real Time)

BKKT      BAKKT HOLDINGS INC.      Wait for Money Wave Close > 20 with High Volume.

LI      LI AUTO INC.      Buy above the the Pink Line around $31.46 with High Volume with a 5% Trailing Sell Stop Loss below it.      

LPTX      LEAP THERA.     Buy above the Pink Line around $2.66 with High Volume with a 5% Trailing Sell Stop Loss below it.   

SLI      STANDARD LITHIUM LTD.      Wait for Money Wave Close > 20 with High Volume.

Please be patient and wait for Money Wave Buy Signals.  We will email you when they are ready. Follow on the WATCH LIST.      
Emotions are very high now, so please do not Buy unless you are VERY NIMBLE.

The Leaders are Way Above the Green Lines (all Investments eventually return to their Green Lines).      

____________________________________________________________________________________________________________

SELLS TODAY     

ANY      SPHERE 3D CORP.      Slipped below the Buy Price of $6.74 and was Stopped Out. This trade was not logged.   

BTU      PEABODY ENERGY CORP.      EXIT if it is going to Close below Support of $10.96.  This trade was not logged.

UPST      UPSTART HOLDINGS INC.       LOWER the Sell Stop Loss below $220 until it bottoms. FEAR is causing Selling from Earnings. We will probably Buy a 2nd batch on the next Buy Signal, and then try to Sell it all around the Red Line (50-day avg.)

XLRE      REAL ESTATE FUND      EXIT if it is going to Close below the Pink Line around $48.24. The Target was already Hit for a 5.7% Gain.   

MY TRADING DASHBOARD
DAY TRADING SETUPS, and then 
NEW:  TRADE ALERTS
ARE YOUR INVESTMENTS ABOVE THE GREEN LINE?
ETF SECTOR ROTATION SYSTEM   
New TOP 100 LIST Updated Nov 2, 2021

Many like to Buy the day before, near the Close, if the Money Wave is going to create a Buy Signal (Closing > 20 and out of the Green Zone).

Don’t Buy if the Investment has already popped up too much. Money Wave Buys are usually good for a 3-6 %  move in a few days.

We will “Not Log” trades if the Reward/Risk is not at least 2:1, or Low Volume. These have more risk. 

Related Post

– Money Wave Alert! Nov 9, 2021

Subscribe to Our Newsletter

AGL Logo

Get our eBook Now!

Candlestick - A Swing Traders Friend

We don’t spam! Read our privacy policy for more info.

You’ve been successfully subscribed to our newsletter!

Voted #1 at Stock Charts

SH Chart
Inverse S&P 500 Fund (SH) will have a Money Wave Buy today.

Help Us Help Animals

Help Us Help Animals

Recent Comments

  • Market Breadth Indicators: A Trader’s Guide to Early Trend Detection on Backtesting: Definition and How a Trading Strategy Backtest Works
  • Island Reversal Pattern: Definition and Formation Explained on Double Top Pattern: How to Identify and Trade This Reversal Signal
  • Channel Pattern Guide: What It Is and Why It Matters on A Guide to Forecasting Using Moving Averages
  • What Is a Broadening Bottom Chart Pattern? Full Guide on Bull vs. Bear Market: An Investor’s Guide to Market Phases
  • ATGL Weekly Money Flow - 2025-05-11 on ATGL Top Pick of the Week! Apr 6, 2025

Become a Green Liner!

Help me make more Money in the Stock Market.

ON ATGL

  • DashBoard
  • Weekly Commentary
  • Daily Buy / Sell Signals
  • Day Trade Setup
  • Trading Rooms

Design & Develop By Pixelvect

STRATEGIES

  • Swing Trading
  • ATGL Pick of the Week
  • Dividend Growth
  • ETF Sector Rotation
  • Dogs of the Dow

HELP

  • ATGL Trading Rules
  • FAQ
  • Account Maintenance
  • Contact US
  • Join

FOLLOW US

Instagram Linkedin Twitter Facebook

© COPYRIGHT 2024 · ABOVETHEGREENLINE.COM · ALL RIGHTS RESERVED · PRIVACY · TERMS · CONTACT · WATCHLIST · CURRENT