Above the Green Line -01
  • Market Insights
        • Commentary
          • Daily
          • Weekly
        • BUY / SELL SIGNALS
          • Trade Posts
          • Recent Trade Alerts
          • Recent Day Trades
        • BLOGROLL
          • Dividend Growth Blog
          • ETF Sector Blog
          • Dow Dogs
          • TPOW Blog
  • Strategies
        • SWING TRADING
          • Current Positions
          • Watchlists
          • Closed Positions
          • Candidates - TOP 100
          • Specialty Stocks
        • WEEKLY STOCK PICK
          • TPOW Charts
          • TPOW Performance
          • TPOW Strategy Guide
          • TPOW Performance Dashboard
        • DAY TRADING
          • Watch List
        • ATGL DASHBOARD
        • ETF STRATEGIES
          • ETF Sector Rotation
          • ETF Sector Portfolio
        • DIVIDEND GROWTH
          • Dividend Growth Portfolio
          • Dividend Calendar
        • DOGS OF THE DOW
          • Dogs of the Dow Portfolio
          • DOW 5 Portfolio
  • Markets
        • US MARKET
          • Commodities
          • Energy
          • Precious Metals
          • Volatility
        • GLOBAL MARKETS
          • Market Indices
          • Economic Calendar
          • FOREX Heat Map
          • FOREX Cross Rates
          • Crypto Currency Market
  • Investing
    • Discord Community
    • Dashboard
  • Resources
        • ARTICLES
          • Dividend Growth Model Articles
          • ETF Articles
          • Investment Strategies Articles
          • Market and Economic Insights
          • Stock Trade Articles
          • Stock Reviews
        • TOOLS
          • Stock Scanners
          • Charting Software
          • Brokerage Firms
        • STOCK CHARTS
          • Key Components
          • Reading Charts
          • Drawing Stock Charts
          • Identifying Trends
        • RETIREMENT PLANNING
  • About
    • Contact Us
    • How to Win
    • #1 At Stockcharts
    • Disclaimer
    • FAQ
  • Log In
  • Subscribe

March 13, 2023

Money Wave Alert! Mar 13, 2023

SPX Chart
The S&P 500 Index is back down in the Green Zone for Buy Signals soon.

Markets were mostly higher today, as the Markets are going down to Force the FED to stop Tightening. Now maybe the FED will only Raise 1/4 point at their next meeting. Investor’s FEAR has become very High, and that is when we like to Buy. Investors are worried about the FED raising Rates again, and historically this causes an Economic slow down.

The Leaders and Indices are quickly back down in the Green Zones (probably too late to Sell for the short term) so prepare to Buy next week. The  WATCH LIST is growing again, but please be patient and Wait for Buy Signals. Buying interest on Stocks is low until Interest Rates top out.  

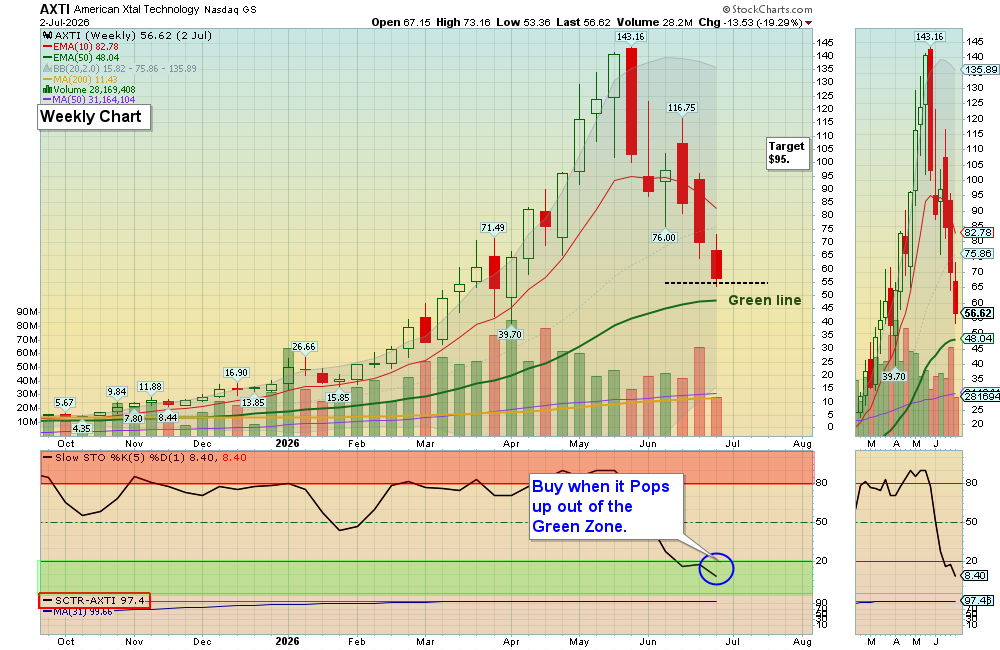
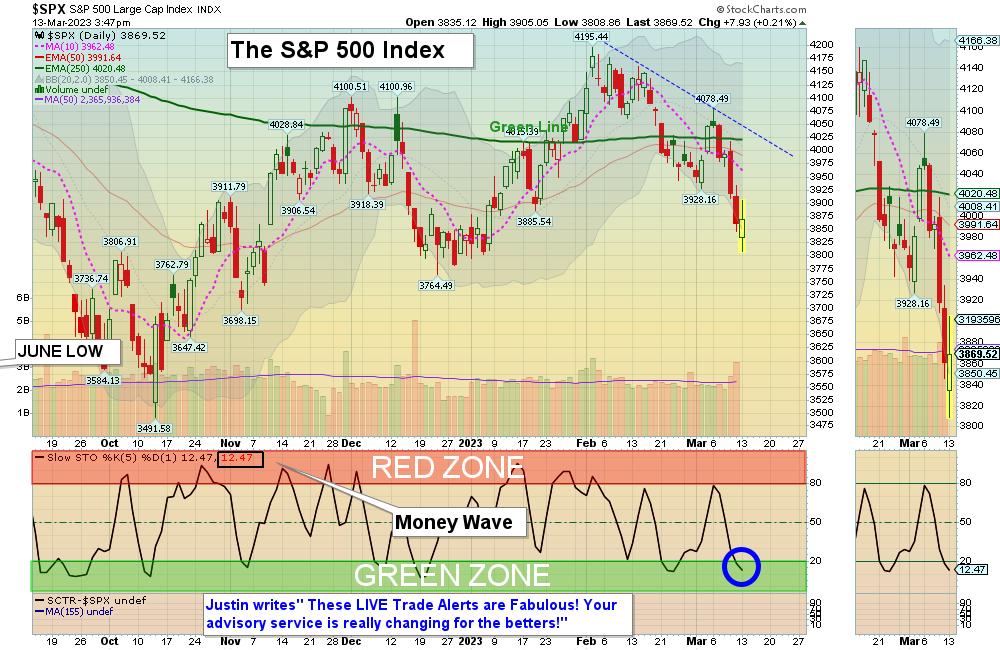
Please be patient and wait for Buy Signals for that are still Above the Green Lines.  SOON – CHARTS  The best moves happen when the S&P 500 Index is also coming up out of the Green Zone. 

_________________________________________________________________________________________________________________

BUYS TODAY   3/13/2023     

TCOM      TRIP.COM GROUP      Money Wave Buy today. Target is $39. EXIT if it is going to Close below $34.90.

BUYS TOMORROW                    

COTY      COTY INC.      Wait for Money Wave Close > 20 with High Volume.

HIMS      HIS & HERS HEALTH INC.      Wait for Money Wave Close > 20 with High Volume.     

Shop for a better price earlier in the day with Triple Buy Signal, on the same day that a Daily Money Wave Buy Signal will occur.  

BUYS SOON             

FTI      TECHNIPFMC PLC       Wait for Money Wave Close > 20 with High Volume.     

PR      PERMIAN RESOURCES CORP.      Wait for Money Wave Close > 20 with High Volume.

TCOM      TRIP.COM GROUP      Wait for Money Wave Close > 20 with High Volume.     

STLD      STEEL DYNAMIC INC.      Wait for Money Wave Close > 20 with High Volume.     

XME      METALS & MINING FUND       Relative Strength has dropped below 90. AVOID.

Please be patient and Wait for Money Wave Buy Signals.  We will email you when they are ready. Follow on the WATCH LIST.   

SELLS TODAY              

FSLR      FIRST SOLAR      EXIT if it is going to Close below the Pink Line around $2o3.61. The Target was Already Hit for an 8.2% Gain. 

________________________________________________________________________

DAY TRADING SETUPS.  Follow our YouTube Live Stream for quick trades. Or look for Triple Buy Pops (3 Green Circles). Movers today:   TARK (+7%)  LABU (+9%) MARA (+27%) & SOXS (+5%). Try out the New Side by Side layout.      

DAY TRADING FOR INDICES & LARGE CAPS CHARTS.

Bonds were up today but are Below the Green Line.  

Crude Oil was down $2.17 today at $74.50.

MY TRADING DASHBOARD 
SWING TRADING CURRENT POSITIONS
DAY TRADING SETUPS
TRADE ALERTS
GREEN LINE CHARTS AT STOCKCHARTS
ARE YOUR INVESTMENTS ABOVE THE GREEN LINE?
GREEN LINE RULES
ETF SECTOR ROTATION SYSTEM   
New TOP 100 LIST Updated Mar 1, 2023

Many like to Buy the Swing Trades just before the Close, if the Money Wave is going to create a Buy Signal (Closing > 20 and up out of the Green Zone). Don’t Buy if the Security has already popped up too much. Money Wave Buy Signals are usually good for a 3-6 % move in a few days.

We will “Not Log” trades if the Reward/Risk is not at least 2:1, or Low Volume. These have more risk. 

Related Post

– TCOM

Trackbacks

  1. Money Wave Alert! Mar 13, 2023 – InvFuture Education says:
    March 13, 2023 at 6:47 pm

    […] post Money Wave Alert! Mar 13, 2023 appeared first on Above The Green […]

    Log in to Reply

Subscribe to Our Newsletter

AGL Logo

Get our eBook Now!

Candlestick - A Swing Traders Friend

We don’t spam! Read our privacy policy for more info.

You’ve been successfully subscribed to our newsletter!

Voted #1 at Stock Charts

SH Chart
Inverse S&P 500 Fund (SH) will have a Money Wave Buy today.

Help Us Help Animals

Help Us Help Animals

Recent Comments

  • Market Breadth Indicators: A Trader’s Guide to Early Trend Detection on Backtesting: Definition and How a Trading Strategy Backtest Works
  • Island Reversal Pattern: Definition and Formation Explained on Double Top Pattern: How to Identify and Trade This Reversal Signal
  • Channel Pattern Guide: What It Is and Why It Matters on A Guide to Forecasting Using Moving Averages
  • What Is a Broadening Bottom Chart Pattern? Full Guide on Bull vs. Bear Market: An Investor’s Guide to Market Phases
  • ATGL Weekly Money Flow - 2025-05-11 on ATGL Top Pick of the Week! Apr 6, 2025

Become a Green Liner!

Help me make more Money in the Stock Market.

ON ATGL

  • DashBoard
  • Weekly Commentary
  • Daily Buy / Sell Signals
  • Day Trade Setup
  • Trading Rooms

Design & Develop By Pixelvect

STRATEGIES

  • Swing Trading
  • ATGL Pick of the Week
  • Dividend Growth
  • ETF Sector Rotation
  • Dogs of the Dow

HELP

  • ATGL Trading Rules
  • FAQ
  • Account Maintenance
  • Contact US
  • Join

FOLLOW US

Instagram Linkedin Twitter Facebook

© COPYRIGHT 2024 · ABOVETHEGREENLINE.COM · ALL RIGHTS RESERVED · PRIVACY · TERMS · CONTACT · WATCHLIST · CURRENT