Above the Green Line -01
  • Market Insights
        • Commentary
          • Daily
          • Weekly
        • BUY / SELL SIGNALS
          • Trade Posts
          • Recent Trade Alerts
          • Recent Day Trades
        • BLOGROLL
          • Dividend Growth Blog
          • ETF Sector Blog
          • Dow Dogs
          • TPOW Blog
  • Strategies
        • SWING TRADING
          • Current Positions
          • Watchlists
          • Closed Positions
          • Candidates - TOP 100
          • Specialty Stocks
        • WEEKLY STOCK PICK
          • TPOW Charts
          • TPOW Performance
          • TPOW Strategy Guide
          • TPOW Performance Dashboard
        • DAY TRADING
          • Watch List
        • ATGL DASHBOARD
        • ETF STRATEGIES
          • ETF Sector Rotation
          • ETF Sector Portfolio
        • DIVIDEND GROWTH
          • Dividend Growth Portfolio
          • Dividend Calendar
        • DOGS OF THE DOW
          • Dogs of the Dow Portfolio
          • DOW 5 Portfolio
  • Markets
        • US MARKET
          • Commodities
          • Energy
          • Precious Metals
          • Volatility
        • GLOBAL MARKETS
          • Market Indices
          • Economic Calendar
          • FOREX Heat Map
          • FOREX Cross Rates
          • Crypto Currency Market
  • Investing
    • Discord Community
    • Dashboard
  • Resources
        • ARTICLES
          • Dividend Growth Model Articles
          • ETF Articles
          • Investment Strategies Articles
          • Market and Economic Insights
          • Stock Trade Articles
          • Stock Reviews
        • TOOLS
          • Stock Scanners
          • Charting Software
          • Brokerage Firms
        • STOCK CHARTS
          • Key Components
          • Reading Charts
          • Drawing Stock Charts
          • Identifying Trends
        • RETIREMENT PLANNING
  • About
    • Contact Us
    • How to Win
    • #1 At Stockcharts
    • Disclaimer
    • FAQ
  • Log In
  • Subscribe

March 10, 2022

Money Wave Alert! Mar 10, 2022

XLK Chart
Tech Stocks (XLK) are still struggling Below the Green Line.

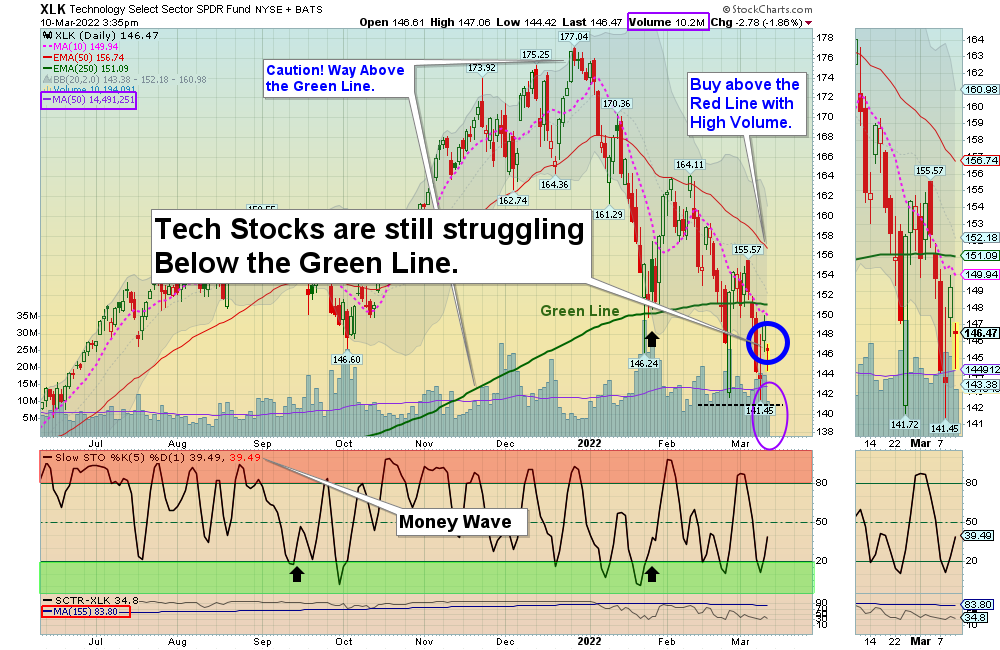
Markets were lower today on major indecision for Buying or Selling. Some investors are betting that the Indices are going to hold and bounce up near the February Lows. But the low Volume today tells us that many are still scared. Markets need to bounce up soon to remain Bullish. Currently all of the major Index are Below the Green Lines, but the FEAR levels are very high. 

Historically FEAR is usually a good time to Buy, but Smart Money is Waiting for the Indices to stop making lows and form a Double Bottom or “W” pattern. We currently only have 5 of 10 positions, and hope to Buy more soon after this emotional Flushing is over.

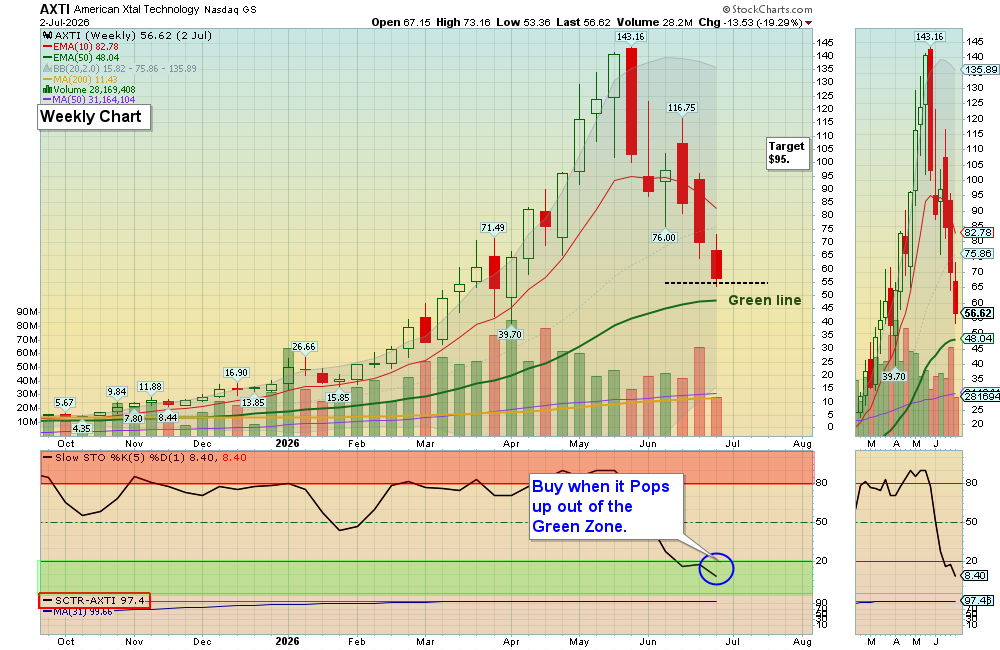
New Subscribers:  We are cautious now as the Volume is low. We need High Volume for better moves up. Please be patient and Wait for more Buy Signals soon. BUYS SOON – CHARTS  The best moves are when the S&P 500 Index is also coming up out of the Green Zone (Like now!)

BUYS TODAY    3/10/2022    

HUN      HUNTSMAN CORP.    Money Wave Buy today, but  HUN will not be Bought or Logged as the Volume was below average of 2.3 MIL.

We will “Not Log” trades if the Reward/Risk is not at least 2:1, or Low Volume. These have more risk.

BUYS TOMORROW – JUMP START STOCKS  Shop for a better price earlier in the day. Only use Jump Start on the same day that a Daily Money Wave Buy Signal will occur.   

F      FORD MOTOR CO.      Wait for Money Wave Close > 20 with High Volume. 

KAR      KAR AUCTION SERVICES    Buy above $18.10 with High Volume with a 5% Trailing Sell Stop Loss below it.     

PBR      PETROBRAS ENERGY      Money Wave must Close in the Green Zone.   

BUYS SOON – CHARTS      WATCH LIST

BTI       BRITISH AMER TOBACCO PLC      Buy above $41.40 with High Volume with a 5% Trailing Sell Stop Loss below it.

TWNK      HOSTESS BRANDS INC.      Wait for Money Wave Close > 20 with High Volume.

Please be patient and wait for Money Wave Buy Signals.  We will email you when they are ready. Follow on the WATCH LIST.      
The Leaders are Way Above the Green Lines (all Investments eventually return to their Green Lines).   

SELLS TODAY     

SB      SAFE BULKERS INC.       Target was Hit yesterday at $4.75 for a 28 % Gain. (Long Term Portfolio).

_________________________________________________________________________________________________________________

DAY TRADING SETUPS.  A few Triple Buy Pops today: TZA (+4%) & SQQQ (+6%).  Try out the New Side by Side layout.   

DAY TRADING FOR INDICES & LARGE CAPS CHARTS.

Bonds  were down again today, and are Below the Green Line. 

Crude Oil was down $2.20 today at $106.50.

_________________________________________________________________________________________________________________

MY TRADING DASHBOARD 
SWING TRADING CURRENT POSITIONS
DAY TRADING SETUPS
TRADE ALERTS
ARE YOUR INVESTMENTS ABOVE THE GREEN LINE?
GREEN LINE RULES
ETF SECTOR ROTATION SYSTEM   
New TOP 100 LIST Updated Mar 1, 2022

Many like to Buy the Swing Trades just before the Close, if the Money Wave is going to create a Buy Signal (Closing > 20 and up out of the Green Zone).

Don’t Buy if the Investment has already popped up too much. Money Wave Buy Signals are usually good for a 3-6 %  move in a few days.

We will “Not Log” trades if the Reward/Risk is not at least 2:1, or Low Volume. These have more risk.

Related Post

– HUN

Subscribe to Our Newsletter

AGL Logo

Get our eBook Now!

Candlestick - A Swing Traders Friend

We don’t spam! Read our privacy policy for more info.

You’ve been successfully subscribed to our newsletter!

Voted #1 at Stock Charts

SH Chart
Inverse S&P 500 Fund (SH) will have a Money Wave Buy today.

Help Us Help Animals

Help Us Help Animals

Recent Comments

  • Market Breadth Indicators: A Trader’s Guide to Early Trend Detection on Backtesting: Definition and How a Trading Strategy Backtest Works
  • Island Reversal Pattern: Definition and Formation Explained on Double Top Pattern: How to Identify and Trade This Reversal Signal
  • Channel Pattern Guide: What It Is and Why It Matters on A Guide to Forecasting Using Moving Averages
  • What Is a Broadening Bottom Chart Pattern? Full Guide on Bull vs. Bear Market: An Investor’s Guide to Market Phases
  • ATGL Weekly Money Flow - 2025-05-11 on ATGL Top Pick of the Week! Apr 6, 2025

Become a Green Liner!

Help me make more Money in the Stock Market.

ON ATGL

  • DashBoard
  • Weekly Commentary
  • Daily Buy / Sell Signals
  • Day Trade Setup
  • Trading Rooms

Design & Develop By Pixelvect

STRATEGIES

  • Swing Trading
  • ATGL Pick of the Week
  • Dividend Growth
  • ETF Sector Rotation
  • Dogs of the Dow

HELP

  • ATGL Trading Rules
  • FAQ
  • Account Maintenance
  • Contact US
  • Join

FOLLOW US

Instagram Linkedin Twitter Facebook

© COPYRIGHT 2024 · ABOVETHEGREENLINE.COM · ALL RIGHTS RESERVED · PRIVACY · TERMS · CONTACT · WATCHLIST · CURRENT