Above the Green Line -01
  • Market Insights
        • Commentary
          • Daily
          • Weekly
        • BUY / SELL SIGNALS
          • Trade Posts
          • Recent Trade Alerts
          • Recent Day Trades
        • BLOGROLL
          • Dividend Growth Blog
          • ETF Sector Blog
          • Dow Dogs
          • TPOW Blog
  • Strategies
        • SWING TRADING
          • Current Positions
          • Watchlists
          • Closed Positions
          • Candidates - TOP 100
          • Specialty Stocks
        • WEEKLY STOCK PICK
          • TPOW Charts
          • TPOW Performance
          • TPOW Strategy Guide
          • TPOW Performance Dashboard
        • DAY TRADING
          • Watch List
        • ATGL DASHBOARD
        • ETF STRATEGIES
          • ETF Sector Rotation
          • ETF Sector Portfolio
        • DIVIDEND GROWTH
          • Dividend Growth Portfolio
          • Dividend Calendar
        • DOGS OF THE DOW
          • Dogs of the Dow Portfolio
          • DOW 5 Portfolio
  • Markets
        • US MARKET
          • Commodities
          • Energy
          • Precious Metals
          • Volatility
        • GLOBAL MARKETS
          • Market Indices
          • Economic Calendar
          • FOREX Heat Map
          • FOREX Cross Rates
          • Crypto Currency Market
  • Investing
    • Discord Community
    • Dashboard
  • Resources
        • ARTICLES
          • Dividend Growth Model Articles
          • ETF Articles
          • Investment Strategies Articles
          • Market and Economic Insights
          • Stock Trade Articles
          • Stock Reviews
        • TOOLS
          • Stock Scanners
          • Charting Software
          • Brokerage Firms
        • STOCK CHARTS
          • Key Components
          • Reading Charts
          • Drawing Stock Charts
          • Identifying Trends
        • RETIREMENT PLANNING
  • About
    • Contact Us
    • How to Win
    • #1 At Stockcharts
    • Disclaimer
    • FAQ
  • Log In
  • Subscribe

June 1, 2023

Money Wave Alert! Jun 1, 2023

QQQ Chart
The NASDAQ 100 Fund (QQQ) is retesting the recent Highs.

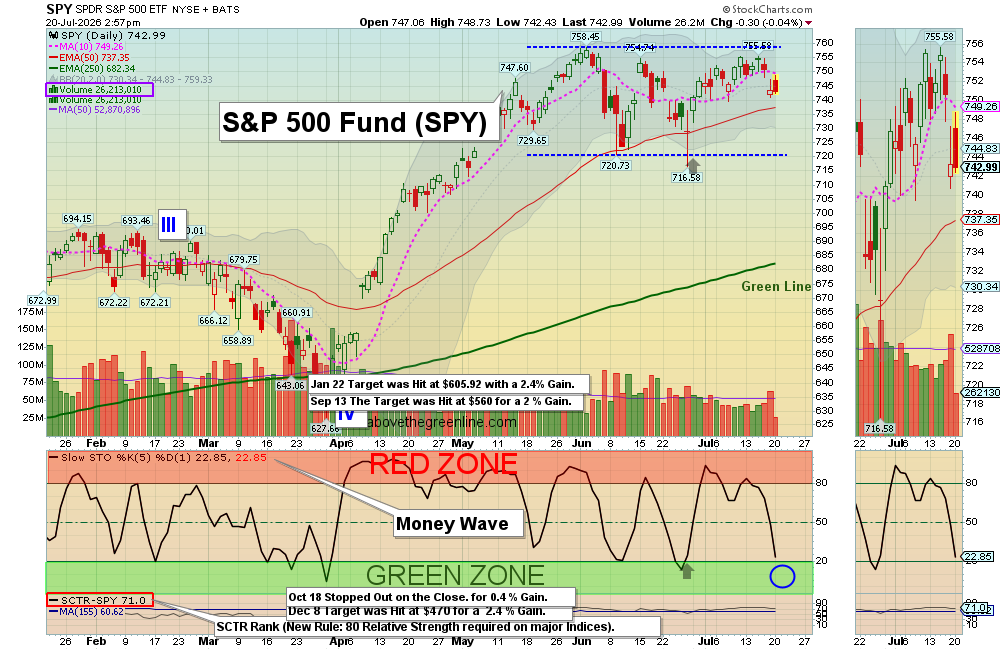
Markets were higher today as the strongest Leaders are retesting the recent High. The Big Tech NASDAQ 100 Fund and Semiconductors do not have as much power today. The S&P 500 Index  is up near highs but is struggling to punch thru.

The Leaders and Indices are currently over bought and up in the Red Zones (probably too late to Buy for the short term). Volume has been very low, so be patient and WAIT for Buy Signals..

Please be patient and wait for Buy Signals for ones that are still Above the Green Lines.  SOON – CHARTS  The best moves happen when the S&P 500 Index is also coming up out of the Green Zone. 

New TOP 100 LIST Updated Jun 1, 2023

__________________________________________________________________________

BUYS TODAY   6/1/2023        

ARDX      ARDELYX INC.    Money Wave Buy today, but ARDX will not be Bought or Logged as the Volume is below average of 5.7 MIL.

DKNG      DRAFTKINGS INC.      Money Wave Buy today, but DKNG will not be Bought or Logged as it is already up 6% today. Maybe you got some earlier on the Triple Buy Signal.

GFI      GOLD FIELDS LTD.      Moved above $15.40 today, but the Volume was not High. AVOID.

HMY      HARMONY GOLD MINING    Moved above $4.80 today, but the Volume was not High. AVOID.

We will “Not Log” trades if the Reward/Risk is not at least 2:1, or Low Volume. These have more risk

BUYS TOMORROW                      

TIO      TINGO GROUP INC.      Wait for Money Wave Close > 20 with High Volume.   

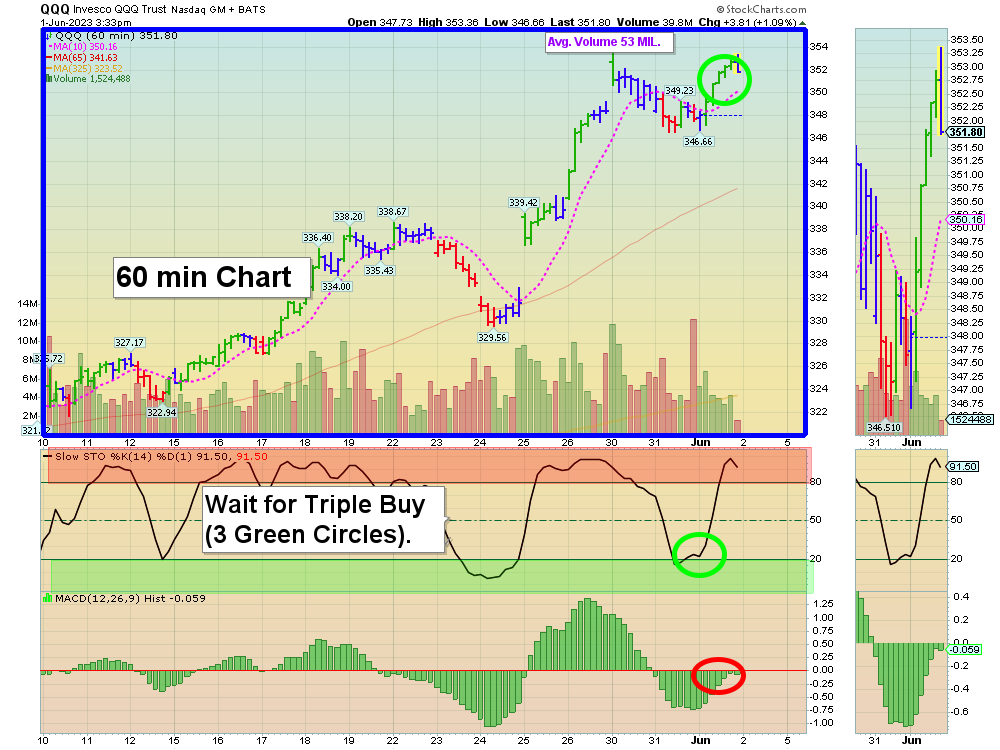
Shop for a better price earlier in the day with Triple Buy Signal, on the same day that a Daily Money Wave Buy Signal will occur.  

BUYS SOON      NONE TODAY                

Please be patient and Wait for Money Wave Buy Signals.  We will email you when they are ready. Follow on the WATCH LIST.   

SELLS TODAY              

TSLQ      INVERSE TESLA FUND       Tesla Stock is closing Above the Green Line today, so we would normally Stop Out of TSLQ today. But Tesla Stock  is up in the Red Zone, so we will LOWER the Sell Stop on TSLQ to $40. Then we will  probably EXIT TSLQ next time it is up in the Red Zone.

_________________________________________________________________________

DAY TRADING SETUPS.  We have a new Discord Site for Live Chatting. Follow our YouTube Live Stream for quick trades. Or look for Triple Buy Pops (3 Green Circles). Movers today:   TIO  (+12%) UPST (+12%) SOXL  (+6%). Try out the Side by Side layout.      

DAY TRADING FOR INDICES & LARGE CAPS CHARTS.

Bonds were up today but are Below the Green Line.  

Crude Oil was up $2.01 today at $70.10.

MY TRADING DASHBOARD 
SWING TRADING CURRENT POSITIONS
DAY TRADING SETUPS
TRADE ALERTS
GREEN LINE CHARTS AT STOCKCHARTS
ARE YOUR INVESTMENTS ABOVE THE GREEN LINE?
GREEN LINE RULES
ETF SECTOR ROTATION SYSTEM   
New TOP 100 LIST Updated Jun 1, 2023

Many like to Buy the Swing Trades just before the Close, if the Money Wave is going to create a Buy Signal (Closing > 20 and up out of the Green Zone). Don’t Buy if the Security has already popped up too much. Money Wave Buy Signals are usually good for a 3-6 % move in a few days.

We will “Not Log” trades if the Reward/Risk is not at least 2:1, or Low Volume. These have more risk. 

Related Post

– ARDX

Subscribe to Our Newsletter

AGL Logo

Get our eBook Now!

Candlestick - A Swing Traders Friend

We don’t spam! Read our privacy policy for more info.

You’ve been successfully subscribed to our newsletter!

Voted #1 at Stock Charts

SH Chart
Inverse S&P 500 Fund (SH) will have a Money Wave Buy today.

Help Us Help Animals

Help Us Help Animals

Recent Comments

  • Market Breadth Indicators: A Trader’s Guide to Early Trend Detection on Backtesting: Definition and How a Trading Strategy Backtest Works
  • Island Reversal Pattern: Definition and Formation Explained on Double Top Pattern: How to Identify and Trade This Reversal Signal
  • Channel Pattern Guide: What It Is and Why It Matters on A Guide to Forecasting Using Moving Averages
  • What Is a Broadening Bottom Chart Pattern? Full Guide on Bull vs. Bear Market: An Investor’s Guide to Market Phases
  • ATGL Weekly Money Flow - 2025-05-11 on ATGL Top Pick of the Week! Apr 6, 2025

Become a Green Liner!

Help me make more Money in the Stock Market.

ON ATGL

  • DashBoard
  • Weekly Commentary
  • Daily Buy / Sell Signals
  • Day Trade Setup
  • Trading Rooms

Design & Develop By Pixelvect

STRATEGIES

  • Swing Trading
  • ATGL Pick of the Week
  • Dividend Growth
  • ETF Sector Rotation
  • Dogs of the Dow

HELP

  • ATGL Trading Rules
  • FAQ
  • Account Maintenance
  • Contact US
  • Join

FOLLOW US

Instagram Linkedin Twitter Facebook

© COPYRIGHT 2024 · ABOVETHEGREENLINE.COM · ALL RIGHTS RESERVED · PRIVACY · TERMS · CONTACT · WATCHLIST · CURRENT