Above the Green Line -01
  • Market Insights
        • Commentary
          • Daily
          • Weekly
        • BUY / SELL SIGNALS
          • Trade Posts
          • Recent Trade Alerts
          • Recent Day Trades
        • BLOGROLL
          • Dividend Growth Blog
          • ETF Sector Blog
          • Dow Dogs
          • TPOW Blog
  • Strategies
        • SWING TRADING
          • Current Positions
          • Watchlists
          • Closed Positions
          • Candidates - TOP 100
          • Specialty Stocks
        • WEEKLY STOCK PICK
          • TPOW Charts
          • TPOW Performance
          • TPOW Strategy Guide
          • TPOW Performance Dashboard
        • DAY TRADING
          • Watch List
        • ATGL DASHBOARD
        • ETF STRATEGIES
          • ETF Sector Rotation
          • ETF Sector Portfolio
        • DIVIDEND GROWTH
          • Dividend Growth Portfolio
          • Dividend Calendar
        • DOGS OF THE DOW
          • Dogs of the Dow Portfolio
          • DOW 5 Portfolio
  • Markets
        • US MARKET
          • Commodities
          • Energy
          • Precious Metals
          • Volatility
        • GLOBAL MARKETS
          • Market Indices
          • Economic Calendar
          • FOREX Heat Map
          • FOREX Cross Rates
          • Crypto Currency Market
  • Investing
    • Discord Community
    • Dashboard
  • Resources
        • ARTICLES
          • Dividend Growth Model Articles
          • ETF Articles
          • Investment Strategies Articles
          • Market and Economic Insights
          • Stock Trade Articles
          • Stock Reviews
        • TOOLS
          • Stock Scanners
          • Charting Software
          • Brokerage Firms
        • STOCK CHARTS
          • Key Components
          • Reading Charts
          • Drawing Stock Charts
          • Identifying Trends
        • RETIREMENT PLANNING
  • About
    • Contact Us
    • How to Win
    • #1 At Stockcharts
    • Disclaimer
    • FAQ
  • Log In
  • Subscribe

February 16, 2017

Money Wave Alert! Feb 16, 2017

AAPL Chart
Apple is Way Above the Green Line!


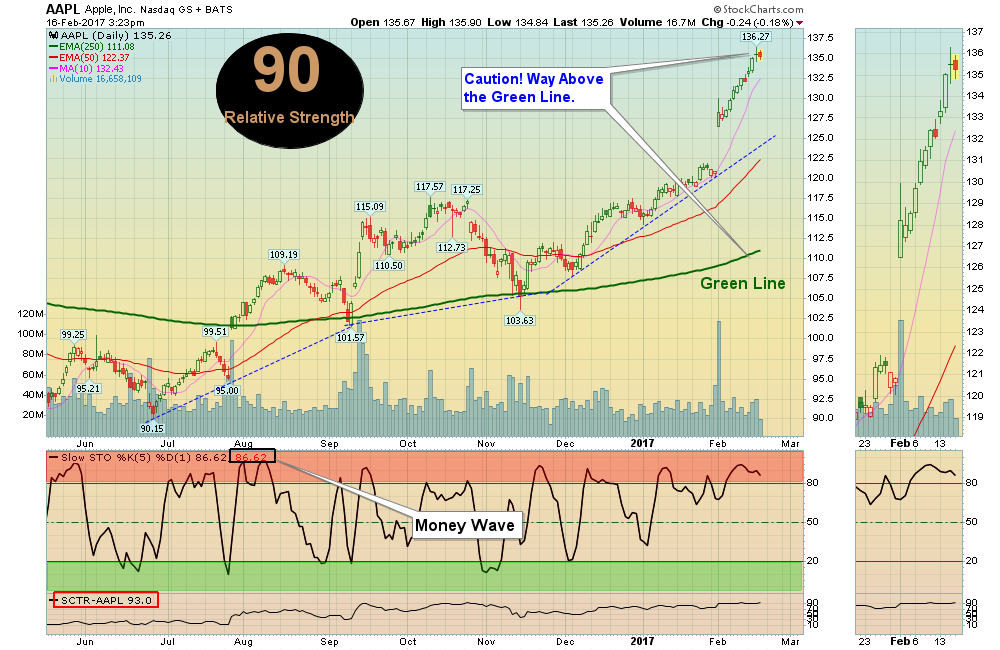
The Markets are getting tired after most Funds are in the Red Zones (probably too late to Buy for the Short Term). Looks like when APPLE gives up, the Markets will finally correct. (There should be a good trade on AAPL near Red Line.)

Remember that Wise Investors Buy on FEAR, and Take Profits when all FEEL GREAT. Most Investors don’t know this, and LOSE MONEY buying at the wrong time. The higher the Markets go, the MORE they want in??? That’s like a retail store RAISING their prices, and Buyers rush in?

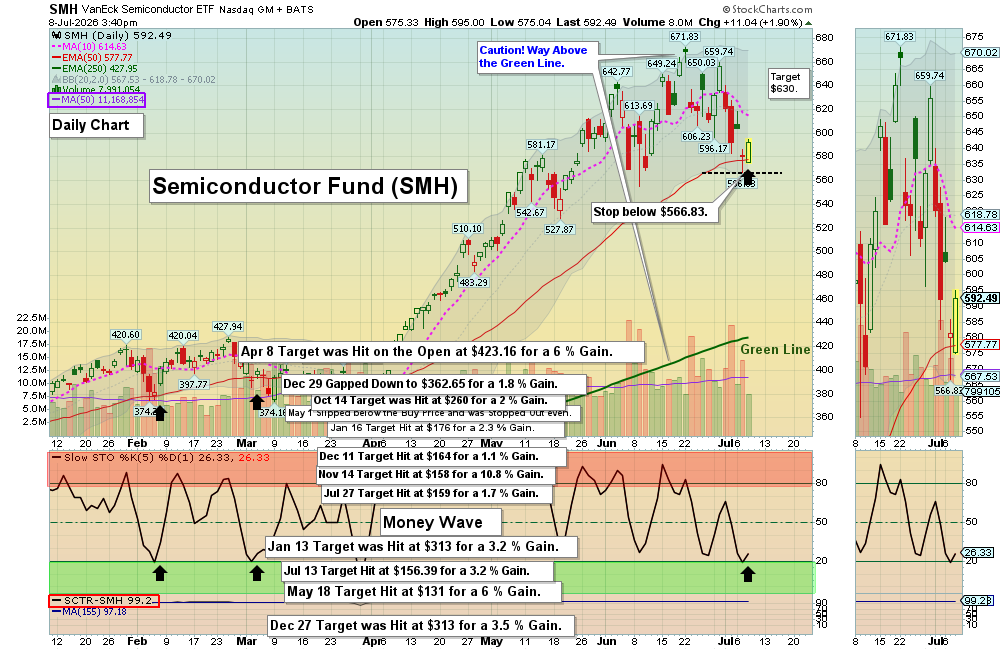
The Reward / Risk  ratio of investing now is poor, so please do not Buy unless you are VERY NIMBLE, as the Leaders are still Way Above the Green Lines.

We are waiting for the S&P 500 to correct back down near the Red Line (50-day avg.) to set up for a good bounce.

Money Wave Buys soon!  
The Following Investments will probably have a Money Wave Buy Signal 
(Slow Stochastic Closing > 20) on today’s Close.

NONE TODAY

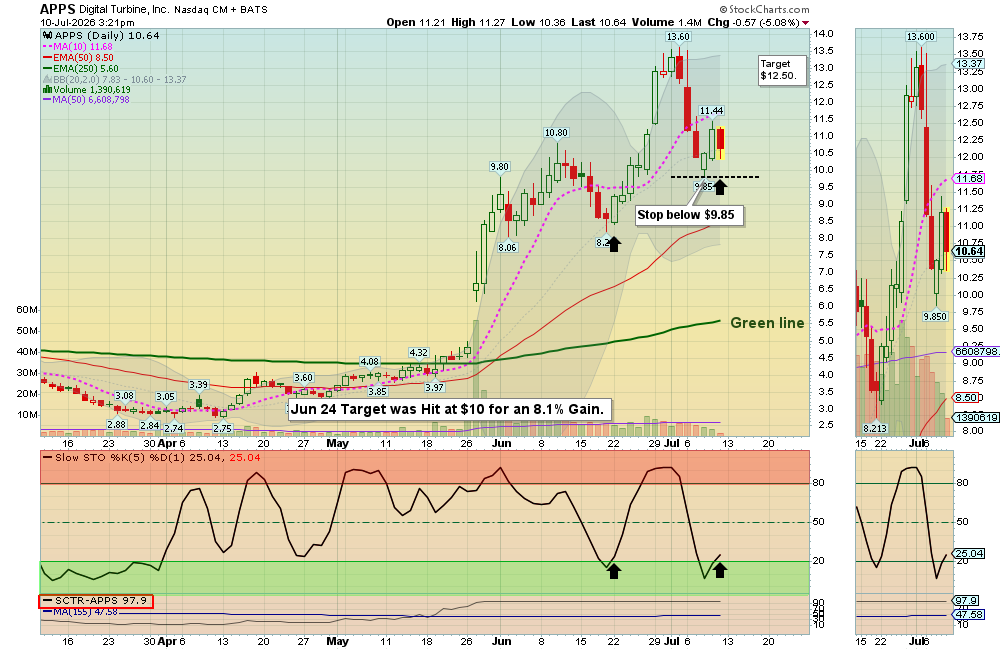
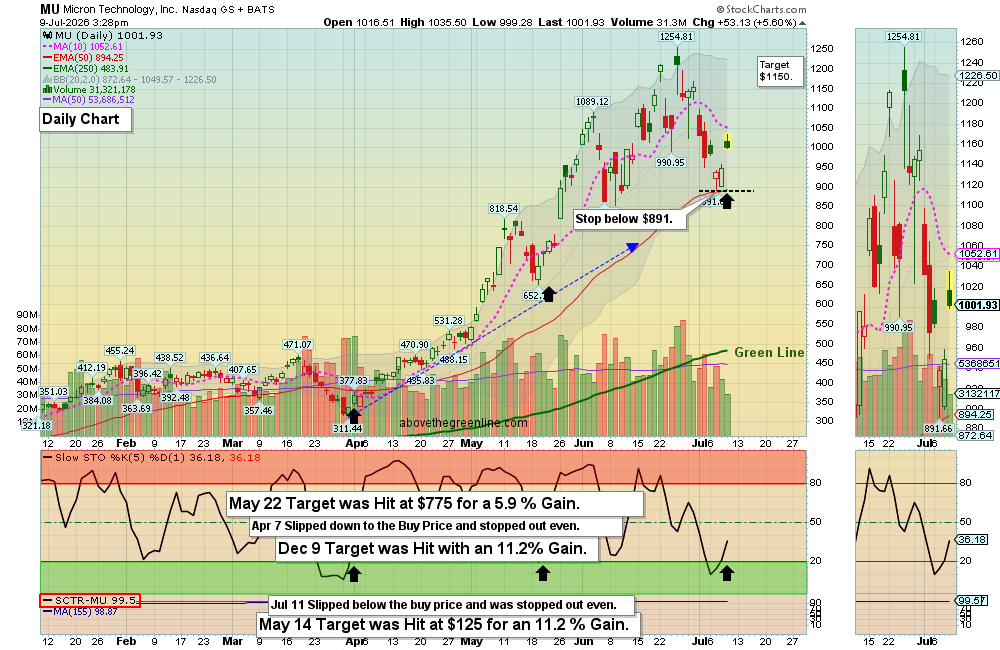
ON DECK to Buy soon:   AMD   MU  NVDA  &  WDC.   We will email when they are ready.


SELLS

SN is down near our Stop at $12.  We will LOWER the Stop to the Red Line of $11.30, as the Correction from the High is very orderly, and the Relative Strength is still 98 from Investor’s Biz Daily… Long Term SN could return to the  2014 High of $38!


Please monitor the OPEN POSITIONS Page and update your Sell Stop Losses. Several are back up in the Red Zones.

Click for  WATCH LIST   

Click for  OPEN POSITIONS

Click for  CLOSED POSITIONS

Many like to Buy the day before, near the Close, if the Money Wave is going to create a Buy Signal (Closing > 20).

Don’t Buy if the Investment has already popped up too much. Money Wave Buys are usually good for a 3-6 %  move in a few days.

About 1/3 of the time, the Money Wave Buys will result small losses, so please use a Sell Stop Loss after all Buy orders.

Related Post

– Money Wave Alert! Feb 15, 2017

Subscribe to Our Newsletter

AGL Logo

Get our eBook Now!

Candlestick - A Swing Traders Friend

We don’t spam! Read our privacy policy for more info.

You’ve been successfully subscribed to our newsletter!

Voted #1 at Stock Charts

SH Chart
Inverse S&P 500 Fund (SH) will have a Money Wave Buy today.

Help Us Help Animals

Help Us Help Animals

Recent Comments

  • Market Breadth Indicators: A Trader’s Guide to Early Trend Detection on Backtesting: Definition and How a Trading Strategy Backtest Works
  • Island Reversal Pattern: Definition and Formation Explained on Double Top Pattern: How to Identify and Trade This Reversal Signal
  • Channel Pattern Guide: What It Is and Why It Matters on A Guide to Forecasting Using Moving Averages
  • What Is a Broadening Bottom Chart Pattern? Full Guide on Bull vs. Bear Market: An Investor’s Guide to Market Phases
  • ATGL Weekly Money Flow - 2025-05-11 on ATGL Top Pick of the Week! Apr 6, 2025

Become a Green Liner!

Help me make more Money in the Stock Market.

ON ATGL

  • DashBoard
  • Weekly Commentary
  • Daily Buy / Sell Signals
  • Day Trade Setup
  • Trading Rooms

Design & Develop By Pixelvect

STRATEGIES

  • Swing Trading
  • ATGL Pick of the Week
  • Dividend Growth
  • ETF Sector Rotation
  • Dogs of the Dow

HELP

  • ATGL Trading Rules
  • FAQ
  • Account Maintenance
  • Contact US
  • Join

FOLLOW US

Instagram Linkedin Twitter Facebook

© COPYRIGHT 2024 · ABOVETHEGREENLINE.COM · ALL RIGHTS RESERVED · PRIVACY · TERMS · CONTACT · WATCHLIST · CURRENT