Above the Green Line -01
  • Market Insights
        • Commentary
          • Daily
          • Weekly
        • BUY / SELL SIGNALS
          • Trade Posts
          • Recent Trade Alerts
          • Recent Day Trades
        • BLOGROLL
          • Dividend Growth Blog
          • ETF Sector Blog
          • Dow Dogs
          • TPOW Blog
  • Strategies
        • SWING TRADING
          • Current Positions
          • Watchlists
          • Closed Positions
          • Candidates - TOP 100
          • Specialty Stocks
        • WEEKLY STOCK PICK
          • TPOW Charts
          • TPOW Performance
          • TPOW Strategy Guide
          • TPOW Performance Dashboard
        • DAY TRADING
          • Watch List
        • ATGL DASHBOARD
        • ETF STRATEGIES
          • ETF Sector Rotation
          • ETF Sector Portfolio
        • DIVIDEND GROWTH
          • Dividend Growth Portfolio
          • Dividend Calendar
        • DOGS OF THE DOW
          • Dogs of the Dow Portfolio
          • DOW 5 Portfolio
  • Markets
        • US MARKET
          • Commodities
          • Energy
          • Precious Metals
          • Volatility
        • GLOBAL MARKETS
          • Market Indices
          • Economic Calendar
          • FOREX Heat Map
          • FOREX Cross Rates
          • Crypto Currency Market
  • Investing
    • Discord Community
    • Dashboard
  • Resources
        • ARTICLES
          • Dividend Growth Model Articles
          • ETF Articles
          • Investment Strategies Articles
          • Market and Economic Insights
          • Stock Trade Articles
          • Stock Reviews
        • TOOLS
          • Stock Scanners
          • Charting Software
          • Brokerage Firms
        • STOCK CHARTS
          • Key Components
          • Reading Charts
          • Drawing Stock Charts
          • Identifying Trends
        • RETIREMENT PLANNING
  • About
    • Contact Us
    • How to Win
    • #1 At Stockcharts
    • Disclaimer
    • FAQ
  • Log In
  • Subscribe

April 19, 2021

Money Wave Alert! Apr 19, 2021

SVXY Chart
The Inverse Volatility Fund (Bullish) is over bought and trying to hold above the Pink Line to avoid a Sell Signal.

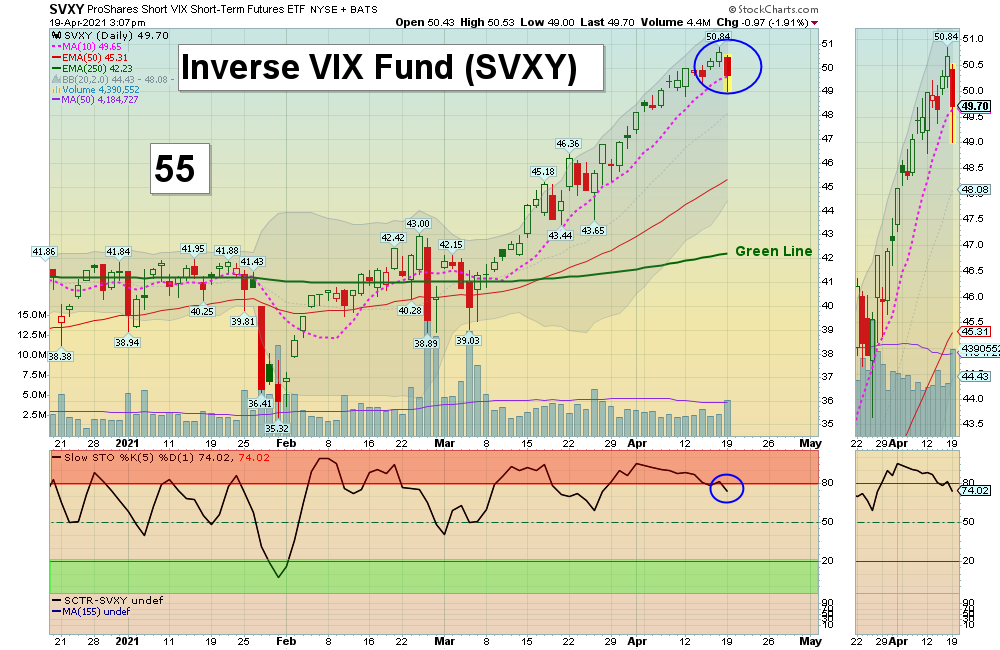
Markets were lower today as profit taking came in on lower Volume. Small Caps, Solar and Semiconductors were leading the Selling. The Indices and the Inverse Volatility Fund SVXY (see chart above) need to hold above the Pink Lines to avoid Short Term Sell Signals.

Yes, it is very FRUSTRATING to Wait for a pull back, but Waiting is one of the hardest parts of Investing. The Small Cap Fund needs to make New Highs soon for this rally to continue. Most of the Leaders and the S&P 500 Index are still near the Red Zones (probably too late to Buy for the Short Term), so we are reluctant to Buy much up here on Highs and with Low Volume.

The better trades happen when the S&P 500 Index is also in the Green Zone. Please be patient and WAIT for pull-backs.

MOXC popped up 19 % today, but most Low Price Investments have not bottomed yet: DAY TRADING SETUPS.

Bonds  were down today, and are below the Green Line.

Crude Oil was up $0.24 today at $63.37.

BUYS TODAY    4/19/2021  NONE TODAY

__________________________________________________________________________________________________________

NEW! JUMP START SCROLLING CHARTS: (Buy Signal should be very soon… Click on the Jump Start link for more info.)      

AMAT      APPLIED MATERIALS INC.      Wait for Money Wave Close > 20 with High Volume.    

VUZI      VUZIX CORP.      Wait for Money Wave Close > 20 with High Volume. 

ZKIN     ZK INT’L. GROUP      Wait for Money Wave Close > 20 with High Volume. (2nd Money Wave Buy soon.)    

____________________________________________________________________________________________________________

WATCH LIST

WATCH LIST SCROLLING CHARTS (Real Time)       

AMRS      AMYRIS INC.    Buy above the Pink Line of $16.00 with High Volume with a 5% Trailing Sell Stop Loss below it.   

BNGO      BIONANO GENOMICS     Buy above the Pink Line of $6.72 with High Volume with a 5% Trailing Sell Stop Loss below it.

DDD      3D SYSTEMS CORP.      Buy above the Pink Line of $22.79 with High Volume with a 5% Trailing Sell Stop Loss below it.  

KOPN      KOPIN CORP.      Wait for Money Wave Close > 20 with High Volume.

MRO      MARATHON OIL      Wait for Money Wave Close > 20 with High Volume. 

PAVM      PAVMED INC.      Wait for Money Wave Close > 20 with High Volume. 

UEC      URANIUM ENERGY CORP.    Buy above $2.96 with High Volume with a 5% Trailing Sell Stop Loss below it. 

Please be patient and wait for Money Wave Buy Signals.  We will email you when they are ready. Follow on the WATCH LIST.
Emotions are very high now, so please do not Buy unless you are VERY NIMBLE.

The Leaders are Way Above the Green Lines (all Investments eventually return to their Green Lines).      

____________________________________________________________________________________________________________

SELLS TODAY   

LYFT      LYFT INC.       EXIT if it is going to Close below your Buy Price, or $62.33.  This trade was not logged.

XRT      RETAIL FUND       EXIT if it is going to Close below the Pink Line around $91.77.  This trade was not logged.

Please update your Sell Stops.    

Click for  CURRENT POSITION CHARTS – Real Time  (Please check and adjust your Sell Stops).         
Click for  CLOSED POSITIONS,   
NEW:       MY TRADING DASHBOARD

DAY TRADING SETUPS
NEW:  TRADE ALERTS
ARE YOUR INVESTMENTS ABOVE THE GREEN LINE?
ETF SECTOR ROTATION SYSTEM   
TOP 100 LIST Updated Apr 4, 2021

Many like to Buy the day before, near the Close, if the Money Wave is going to create a Buy Signal (Closing > 20 and out of the Green Zone).

Don’t Buy if the Investment has already popped up too much. Money Wave Buys are usually good for a 3-6 %  move in a few days.

We will “Not Log” trades if the Reward/Risk is not at least 2:1, or Low Volume. These have more risk.   

Related Post

– Money Wave Alert! Apr 16, 2021

Subscribe to Our Newsletter

AGL Logo

Get our eBook Now!

Candlestick - A Swing Traders Friend

We don’t spam! Read our privacy policy for more info.

You’ve been successfully subscribed to our newsletter!

Voted #1 at Stock Charts

SH Chart
Inverse S&P 500 Fund (SH) will have a Money Wave Buy today.

Help Us Help Animals

Help Us Help Animals

Recent Comments

  • Market Breadth Indicators: A Trader’s Guide to Early Trend Detection on Backtesting: Definition and How a Trading Strategy Backtest Works
  • Island Reversal Pattern: Definition and Formation Explained on Double Top Pattern: How to Identify and Trade This Reversal Signal
  • Channel Pattern Guide: What It Is and Why It Matters on A Guide to Forecasting Using Moving Averages
  • What Is a Broadening Bottom Chart Pattern? Full Guide on Bull vs. Bear Market: An Investor’s Guide to Market Phases
  • ATGL Weekly Money Flow - 2025-05-11 on ATGL Top Pick of the Week! Apr 6, 2025

Become a Green Liner!

Help me make more Money in the Stock Market.

ON ATGL

  • DashBoard
  • Weekly Commentary
  • Daily Buy / Sell Signals
  • Day Trade Setup
  • Trading Rooms

Design & Develop By Pixelvect

STRATEGIES

  • Swing Trading
  • ATGL Pick of the Week
  • Dividend Growth
  • ETF Sector Rotation
  • Dogs of the Dow

HELP

  • ATGL Trading Rules
  • FAQ
  • Account Maintenance
  • Contact US
  • Join

FOLLOW US

Instagram Linkedin Twitter Facebook

© COPYRIGHT 2024 · ABOVETHEGREENLINE.COM · ALL RIGHTS RESERVED · PRIVACY · TERMS · CONTACT · WATCHLIST · CURRENT