
By ATGL
Updated June 5, 2025
Sharp reversals in market direction catch even experienced traders off guard, transforming profitable positions into losses within days. While most traders focus on popular formations like double top patterns, the island reversal pattern offers early technical clues that frequently escape notice. This formation reveals how institutions behave and the changes in momentum that happen before big price changes.
This article explores the technical mechanics of island reversals, examines how gaps and volume create trading opportunities, and demonstrates how to integrate this formation into systematic trading approaches.
Spotting the Island Reversal Pattern in Real Time
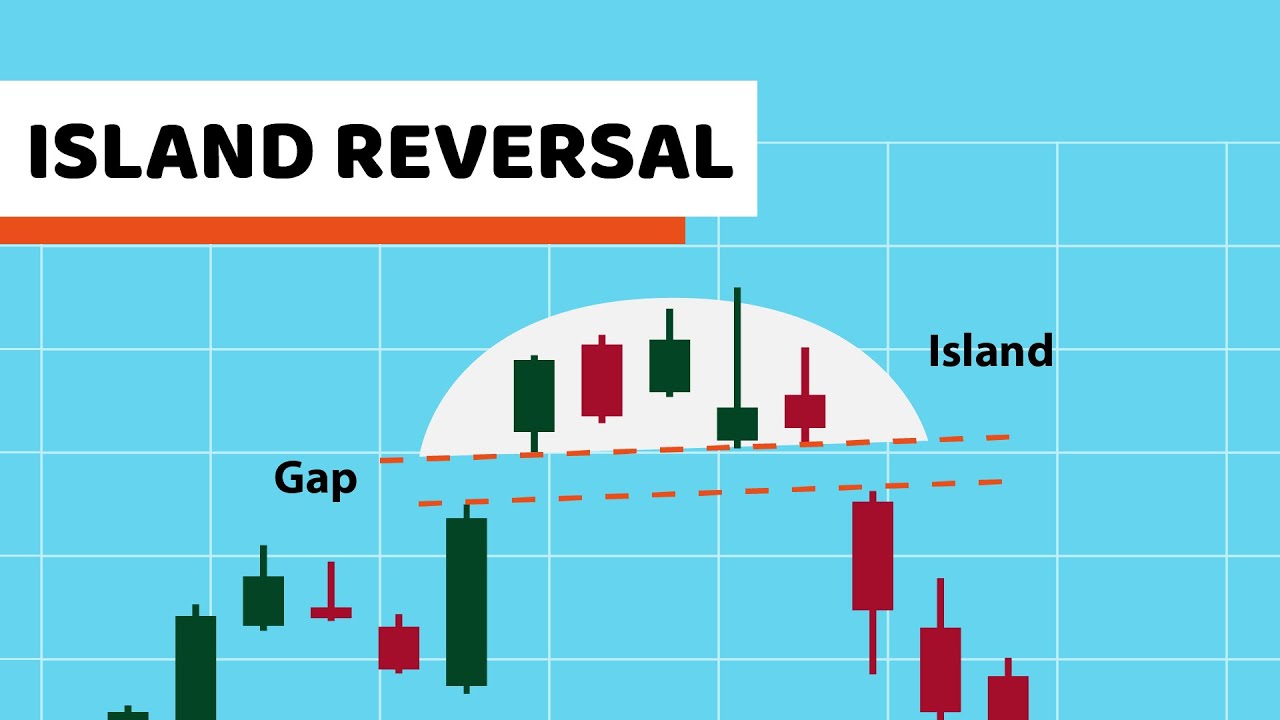
The island reversal pattern occurs when the price moves away from the current trend, stays stable for a short time, and then shifts in the opposite direction. This creates a distinct “island” of price movement that is separated from the surrounding trading areas by gaps on both sides. This pattern indicates a sudden change in market sentiment and often signals major trend reversals.
Island reversals form quickly due to sudden changes, such as large investors shifting their positions or unexpected news that causes prices to move rapidly. This urgency sets them apart from slower, more gradual patterns in trading that build up over time as buying or selling steadily increases.
Island reversals require two distinct gaps: an exhaustion gap that initiates the island formation and a breakaway gap that completes the reversal. Both gaps need to happen within a short time frame, usually between three to seven trading sessions. The area between the gaps shows narrow price ranges with little overlap with previous prices.
Volume patterns are important for confirming island reversals. The exhaustion gap often appears with high trading volume as the prior trend reaches its peak. Volume then decreases during the island phase as uncertainty grows. The breakaway gap should show increased volume that surpasses the exhaustion gap, confirming that institutions are committed to the new direction.
The Role of Gaps in Island Reversal Stock Patterns
Gaps in island reversal patterns reveal institutional trader behaviors that retail traders often miss. An exhaustion gap signals the last push of a trend, indicating that bigger players are changing positions, causing a separation from established trading ranges.
Island reversal gaps typically don’t fill completely in the short term. While exhaustion gaps may partially fill as prices test limits, complete filling usually takes weeks or months. Breakaway gaps often remain unfilled longer as new trends strengthen.
To confirm an island reversal pattern, the exhaustion gap should be at least 2% to 3% of the asset’s price, and the breakaway gap should match this size with volume exceeding recent averages by 50%.
How Exhaustion and Breakaway Gaps Shape the Pattern
Exhaustion gaps develop when trending momentum reaches climactic conditions. These gaps often appear after extended moves that have attracted widespread attention and participation. The gap represents the final surge of buying or selling pressure before sentiment begins shifting toward the opposite direction.
Breakaway gaps form when new information or technical violations force rapid repricing in the opposite direction. These gaps typically occur at the open following overnight developments or during trading sessions when significant technical levels break down.
Early Clues That Signal a Potential Reversal Island Pattern
Price movements before a breakaway gap can indicate potential island reversals. Candlestick patterns, like dojis or small candles with long wicks, show uncertainty, suggesting a gap may form.
Failed continuation attempts also serve as warning signs. If the price struggles to break outside the island, it indicates weakness and hints at an impending gap.
Candlestick clusters within island formations reflect tight trading ranges and market balance. Patterns such as dojis or spinning tops indicate indecision. When these appear after an exhaustion gap, they suggest a weakening trend and a possible reversal.
Volume’s Role in Confirming the Island Reversal Pattern
Volume analysis is important for confirming island reversal patterns. First, there is high volume during the exhaustion gap, then low volume within the island, and finally, expanding volume during the breakaway gap. This pattern helps differentiate real reversals from short-term corrections.
When the breakaway gap shows a volume spike, it indicates that institutions support the new trend. This increase should be at least 25% higher than the volume from the exhaustion gap to ensure reliable confirmation. More volume means more institutional participation, which raises the chances of a lasting trend.
Low volume within the island formation shows uncertainty in the market and a struggle for positions. In this low-volume situation, neither buyers nor sellers have enough confidence to move prices significantly. This balance creates pressure that eventually leads to a gap formation.
Entry and Exit Strategies for Island Reversal Stock Patterns
Trading island reversals requires precise timing to take advantage of changing market momentum while keeping risk in check. There are different strategies for entering trades. Aggressive traders jump in right after a gap forms, using the gap’s opening price to make their move. This method can lead to higher profits, but it also carries more risk if the pattern doesn’t play out as expected. On the other hand, conservative traders wait for clear signs of a trend before they enter a position. This confirmation usually comes when the price stays above the gap for several sessions and shows higher-than-average trading volume.
When it comes to exiting trades, it’s important to consider how strong the new trend might be. Island reversals often signal the start of longer moves that can last for weeks or even months. Using trailing stop-loss orders can help capture these longer moves while also protecting profits if the trend turns against you.
Common Mistakes When Trading the Island Reversal Pattern
Traders often make the mistake of focusing only on the shape of a chart pattern without verifying whether there’s enough trading volume to back it up. Many patterns may appear promising but lack the volume needed to sustain a lasting trend.
Another common mistake is ignoring the larger market. Island reversals that go against major market trends face strong challenges that can stop them from succeeding. Even patterns that seem technically sound may fail if the overall market forces are too strong for the individual security to overcome.
Blending Island Reversal Signals Into a Broader Trading Model
Understanding how to identify stock trends gives you the right context to evaluate island reversals in the broader market.
Technical stock analysis provides a comprehensive framework for evaluating island reversals. Oscillators can identify overbought or oversold conditions that support reversal development, while moving averages help determine whether emerging trends align with longer-term directional bias.
Breadth indicators measure the extent of participation in market movements, providing valuable context for island reversal patterns. When breadth indicators diverge from price action during island formation, they often signal underlying weakness that supports reversal development.
Advance/decline lines, new high-new low ratios, and sector rotation patterns all contribute to breadth analysis. These indicators help determine whether island reversals reflect individual security dynamics or broader market shifts that are likely to persist.
Sharpen Your Edge With Island Reversal Insights That Stick
Success with island reversals requires disciplined application of entry and exit criteria combined with proper risk management techniques.
For traders who want to use island reversal analysis in their trading, Above the Green Line offers a clear system for stock trading strategies. This system provides the structure and discipline needed to apply these advanced techniques consistently. It helps you turn your pattern recognition skills into successful trading results through careful analysis and risk management.
Find out how you can further your trading strategy with an Above the Green Line membership.

Related Articles

Margin Call Explained: What Triggers It and How to Avoid One

AMC Short Squeeze Explained: Timeline, Causes, and Trading Risks

Volatility Clustering in Financial Markets: Understand Why It Happens

Chaikin Money Flow (CMF): How to Use Volume to Spot Real Market Strength
