The dividend discount model (DDM) is a method used by investors to determine the fair value of a company’s stock. This model is particularly useful for investors who prioritize dividend income, offering a straightforward approach to stock valuation. Unlike other methods, DDM assumes that a stock’s current worth is the sum of all future dividend payments, discounted back to their present value.
This article aims to demystify the DDM, highlighting its distinctiveness compared to models like the discounted cash flow model, exploring its variations, and addressing its limitations. Additionally, we’ll guide you on how to use the DDM for constructing a portfolio focused on robust dividend payments.
What Is the Dividend Discount Model (DDM)?
The dividend discount model is one of the primary financial models used in dividend investing. It calculates the fair price of a stock based on expected future dividends, grounded on the theory that investors buy stocks for their dividend income. The core formula of the DDM is:
Where:
P: The present value of the stock.
D: The expected dividends for future periods.
r: The required rate of return for the investment. Also referred to as discount rate or the cost of capital, this rate represents the expected return investors require for investing in a particular stock based on its risk profile.
There are several modified versions of this formula that reflect different assumptions about dividend growth and stability. The precision of DDM and its variations hinge on accurately forecasting future dividends and dividend growth rates, making it a tool that rewards diligent analysis and a deep understanding of a company’s financial health and market position.
DDM vs Discounted Cash Flow Model: Know the Difference
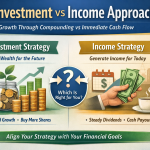
The DDM and discounted cash flow (DCF) model are both methods for valuing a stock. The DCF model evaluates a company’s value by considering its free cash flows. Its broader scope makes it suitable for a wide array of companies, including those not paying current dividends or more focused on retention ratios. On the other hand, DDM’s dividend-centric approach makes it ideal for assessing stocks for which dividend yield and consistency are primary investor concerns. The choice between these models often boils down to the investor’s focus — income from dividends or growth potential.
An important consideration in choosing between DDM and DCF is the nature of the business being evaluated. DDM is often considered more appropriate for mature companies or those with stable and predictable dividend payouts, such as businesses in the utilities or consumer staples sectors. In contrast, DCF might be more suitable for rapidly growing companies, particularly in sectors like technology in which there is more emphasis on high retention ratios and future cash flows rather than on regular dividend payments.
Types of DDM and Analysis of Stock Price Calculations
Depending on different assumptions made, DDM can be simplified and modified to tailor it to various dividend payment scenarios. The zero growth DDM assumes dividends stay constant forever, simplifying the valuation to:
Present Value of Stock = Dividend per Share / Discount Rate
While this model may be easy to use, it is limited in its applicability and does not allow for any growth in dividend payments. In contrast, the constant growth model, or the Gordon growth formula, incorporates a constant rate of growth for dividends into the valuation. The formula is:
Present Value of Stock = Estimate for Next Year’s Dividend per Share / (Discount Rate – Constant Dividend Growth Rate)
The Gordon growth method is more realistic than the zero growth model, but it still has limitations. It assumes a constant, perpetual growth rate that may not accurately reflect real-world scenarios for most companies. For this reason, analysts often employ another variation — the multistage or two-stage dividend discount models. These variants are more flexible than the Gordon growth model (which assumes constant growth) and are used when a company is expected to experience different growth rates at different points in its future. They involve multiple calculations to account for the growth rate in dividends during these various growth phases, offering a nuanced view of a company’s long-term dividend potential.
The multistage growth model is particularly useful for analyzing companies in transitional phases or those experiencing different growth stages. For instance, a company might have a high growth phase in its early years followed by a stabilization phase. This model allows for more flexibility in capturing these changes in growth rates over time, providing a more realistic valuation for companies with complex dividend trajectories.
There is also the one-period valuation model or single-period valuation model. This model calculates a stock’s intrinsic value for a single holding period, typically a year. It takes into account the expected dividend for that year, the estimated stock price at the end of the holding period, and the investor’s required rate of return. It’s meant to be used as a quick and simplified valuation tool, providing a rough estimate of the stock’s value for one specific holding period.
What Are the Limitations of the DDM?
The DDM’s utility is inherently tied to a company’s dividend policy. It falls short for firms that don’t pay dividends or whose dividend patterns are erratic. Moreover, the model is sensitive to the inputs used — slight variations in assumed growth rates or cost of equity capital can markedly alter valuation outcomes. This sensitivity underscores the importance of a thorough, well-reasoned analysis when using DDM. Additionally, DDM tends to favor a long-term investment horizon, as it relies on projecting future dividends, which may not accurately reflect short-term market dynamics or company-specific shocks.
The DDM also may not fully account for the broader economic environment. Factors such as market volatility, interest rate changes, and economic cycles can significantly impact a company’s ability to pay dividends. An investor using the DDM should be aware of these external factors and consider them alongside the model’s output. This holistic approach ensures a more robust and realistic stock valuation, aligning more closely with the complex nature of financial markets.
Create a Portfolio With the Best Stock Dividend Payments
The DDM offers a focused lens for evaluating current stock prices and is particularly useful for investors prioritizing dividend income. Its various forms, from zero growth to multistage growth models, cater to different investment scenarios, allowing for a tailored analysis of companies based on their dividend payout patterns and growth prospects. While effective, the model’s reliance on accurate input assumptions and its lessened applicability to non-dividend-paying companies highlight the need for a balanced and comprehensive approach to stock valuation.
To leverage these insights in building a dividend-rich portfolio, consider exploring Above the Greenline’s dividend growth strategy. Our method combines detailed DDM analysis with a broader market understanding, helping you to select stocks that promise substantial and sustainable dividend returns. Join the Above the Greenline community today and start creating a financial future that works for you.


