Watch List and Charts to Buy Soon.
| Daily Swing Watch List to Buy | Daily Swing Charts to Buy |
| Current Daily Swing Positions | Current Swing Charts |
| Closed Daily Swing Results | Trading Dashboard |
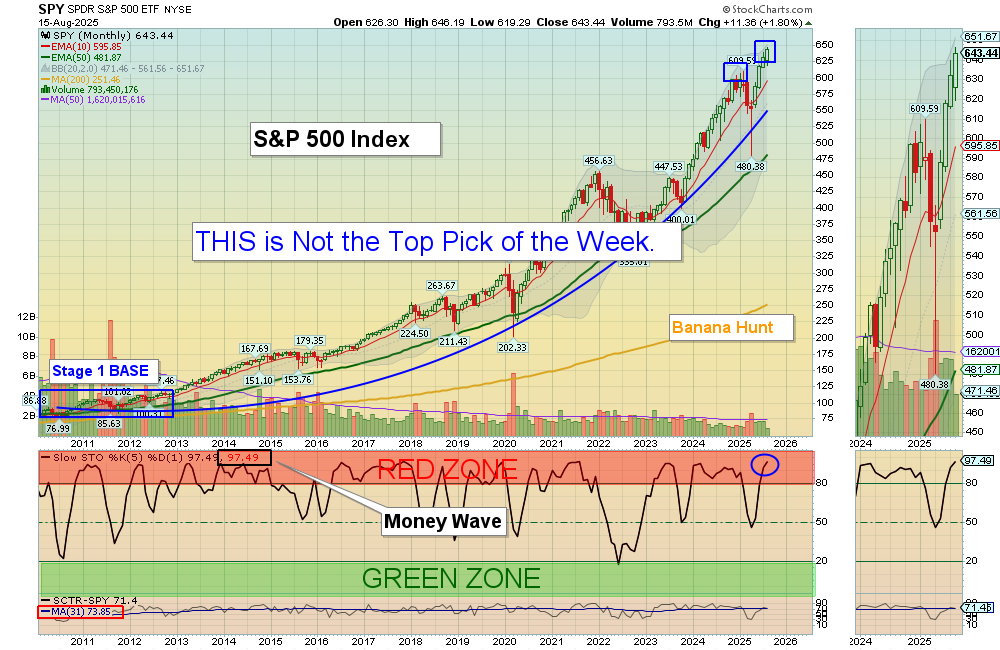
9/02/2024 Markets were higher for the week as the Wave V rally up continued. The S&P 500 Index needed to bounce up at the Pink Line (10-day avg.) to avoid a short term Sell Signal. So far the Big 7 Stocks and AI / Semiconductors are lagging, which could be a warning sign that the rally is not broad based, and tired.
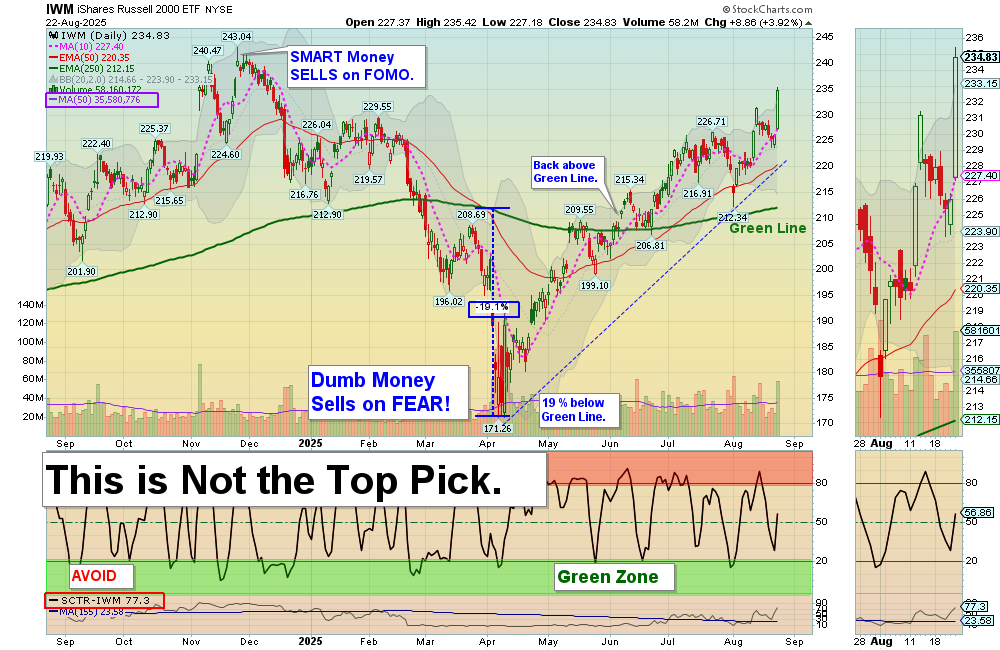
The strongest Stocks are now back above the 50-day averages (Red Lines). If you have some that are not, maybe raise CASH on those below the Red Lines (if your can – those are probably inferior and not Leaders).
The HERD is betting on Stocks going up when the FED Cuts Rates later this month. With FED Printing again soon (more CASH into the system) it is very LOGICAL that Stocks will go higher (like they did in 2020). But many times the Market is not LOGICAL and the HERD is wrong, and too much CASH in the system could bring back Inflation (Bonds don’t like Inflation and dropped 1.93 % this week).
The S&P 500 Index is quickly back up to the recent High (where Sellers came in big), so we are cautions here… Remember, we Buy the Leaders that make new highs on pull-backs. So follow the Green Line System and you should continue to win more than you lose.
If you continue to Follow the Green Line System, your Money should flow into the Strongest areas and your Account value should be able to grow in both Bull and Bear Markets. Follow the MONEY, not the MEDIA.
______________________________________________________________________________
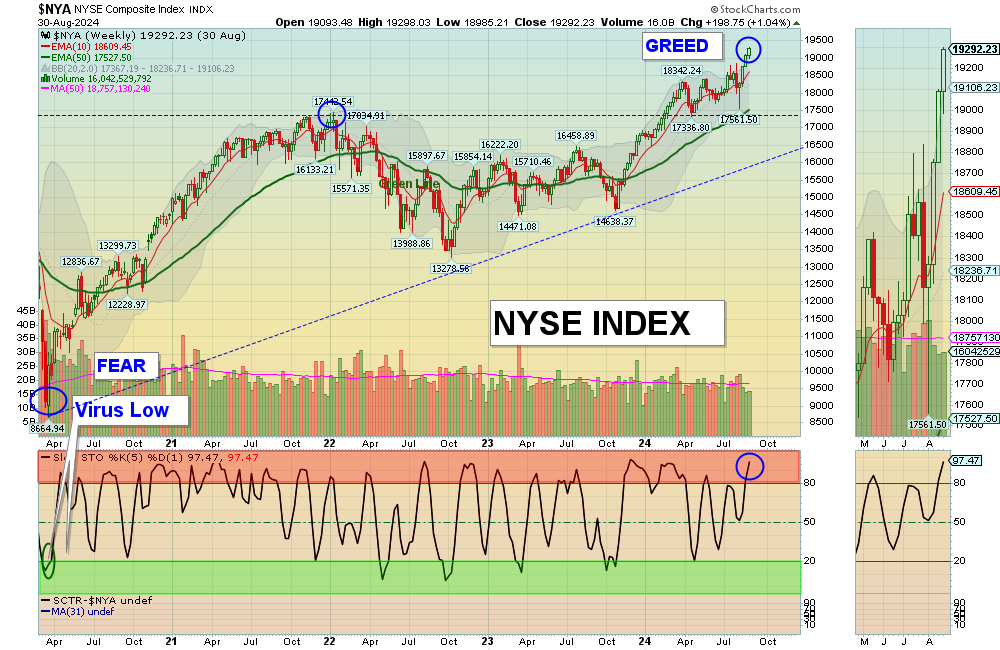
For the week the Dow was up 1.06%, the S&P 500 was up 0.28% and the NASDAQ 100 was down 0.78%. Many of the major Indices still have a Relative Strength below 80, so you should currently own the stronger Funds here.
The Inflation Index (CRB) was down 0.61% for the week and is Below the Green Line, indicating Economic Contraction.
Bonds were down 1.93% for the week, and are Above the Green Line, indicating Economic Contraction.
The US DOLLAR was up 0.02% for the week and is Below the Green Line.
Crude Oil was down 1.71% for the week at $73.55 and GOLD was down 0.73% at $2527.60.
_______________________________________________________________________
COMPLETED SWING TRADES THIS WEEK:
KOLD INVERSE NATURAL GAS FUND The Target was Hit at $75 for a 16.6 % Gain.
_______________________________________________________________________
DAY TRADERS: We are doing many profitable Day Trades on our Discord Trading Hub (free). Please join Discord or X (Twitter) with your cell phone app for the fastest Trade Alerts and Daily email notifications during the day. Other methods of notification have been too slow. Also, please check our our Live Trading Room on YouTube during Market hours.
_______________________________________________________________________
SWING TRADE BUYS SOON:
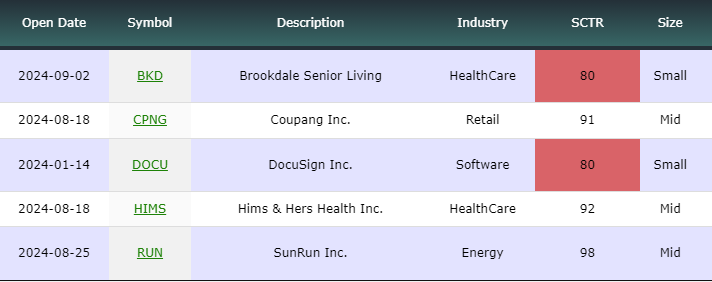
We are now in 5 Three Star logged Swing Trading Positions for the Short & Medium Term. There are 6 investments on the Short Term Watch List.
Be patient and WAIT for Green Zone Buy Signals!
______________________________________________________________________________
LONG TERM WATCH LIST
ATGL Long Term Weekly Watchlist- Click here for scrolling charts.
TRADES THIS WEEK:
AEO AMERICAN OUTFITTERS Slipped below the Buy Price and was Stopped Out with a small Loss.
GAP GAP INC. Slipped below the Buy Price and was Stopped Out with a small Loss.
______________________________________________________________________________
Important Links| Top 100 | Stage Chart Investing | CNN Fear & Greed Index |
| Dividend Growth Portfolio | ETF Sector Portfolio | Dogs of the Dow |
| Long Term Strategy | Stage Chart Investing | Articles |
Alert! Market Risk is High (RED). The probability of successful Short Term Trades is better, when the % of stocks above the 50-day avg. is below 20.
Tell your Friends about the Green Line, and Help Animals.
______________________________________________________________________________
5 Ways to Get your Daily Money Wave Email & Trade Alerts:
-
- Emailed to your box between 3:45 – 3:50 pm EDT.
- Website menu Commentary/Buy/Sell Signals
- Discord Chat. and X (Twitter) @AboveGreenLine are the fastest for Alerts (please set up “mobile notifications”)
- Text messages: Email us your Cell number & phone carrier (slower results).
Thank you,
ATGL