Above the Green Line -01
  • Market Insights
        • Commentary
          • Daily
          • Weekly
        • BUY / SELL SIGNALS
          • Trade Posts
          • Recent Trade Alerts
          • Recent Day Trades
        • BLOGROLL
          • Dividend Growth Blog
          • ETF Sector Blog
          • Dow Dogs
          • TPOW Blog
  • Strategies
        • SWING TRADING
          • Current Positions
          • Watchlists
          • Closed Positions
          • Candidates - TOP 100
          • Specialty Stocks
        • WEEKLY STOCK PICK
          • TPOW Charts
          • TPOW Performance
          • TPOW Strategy Guide
          • TPOW Performance Dashboard
        • DAY TRADING
          • Watch List
        • ATGL DASHBOARD
        • ETF STRATEGIES
          • ETF Sector Rotation
          • ETF Sector Portfolio
        • DIVIDEND GROWTH
          • Dividend Growth Portfolio
          • Dividend Calendar
        • DOGS OF THE DOW
          • Dogs of the Dow Portfolio
          • DOW 5 Portfolio
  • Markets
        • US MARKET
          • Commodities
          • Energy
          • Precious Metals
          • Volatility
        • GLOBAL MARKETS
          • Market Indices
          • Economic Calendar
          • FOREX Heat Map
          • FOREX Cross Rates
          • Crypto Currency Market
  • Investing
    • Discord Community
    • Dashboard
  • Resources
        • ARTICLES
          • Dividend Growth Model Articles
          • ETF Articles
          • Investment Strategies Articles
          • Market and Economic Insights
          • Stock Trade Articles
          • Stock Reviews
        • TOOLS
          • Stock Scanners
          • Charting Software
          • Brokerage Firms
        • STOCK CHARTS
          • Key Components
          • Reading Charts
          • Drawing Stock Charts
          • Identifying Trends
        • RETIREMENT PLANNING
  • About
    • Contact Us
    • How to Win
    • #1 At Stockcharts
    • Disclaimer
    • FAQ
  • Log In
  • Subscribe

November 26, 2017

Green Line Weekly Nov 26, 2017

SPY Chart
S&P 500 is Still Making New Highs.


11/26/2017:  Markets were higher for the week, as Investors continued to Buy the Good News of better than expected Earnings and Tax Cut hopes.

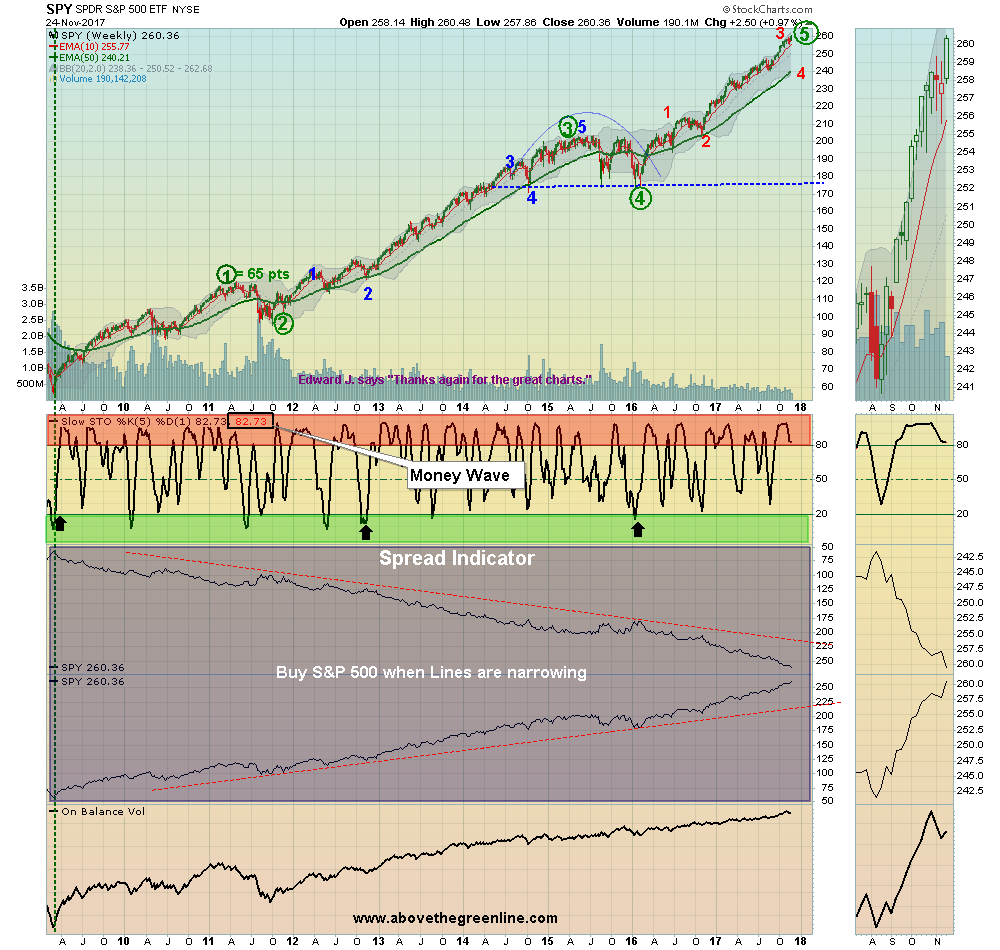
Please be aware that the S&P 500 has not RETURNED to the Green Line in over a year, as Hope and Confidence are very high.  But have some Cash available when the Markets return to the G L.

Most Leading Funds are back up in the Red Zones, so Nimble traders should be raising Cash.  We like to Buy when the Herd is SCARED, and Investments are ON SALE!

Crude Oil was up 3.95% for the week at $58.95, and GOLD was down 0.71%.

___________________________________________________________________________________________

MONEY WAVE BUYS SOON:    We are currently in 3 logged Open Positions, for the Short Term. There is 1 Investment on the Short Term Watch List, so be patient and WAIT for Green Zone Buys!

______________________________________________________________________________________________

LONG TERM TRADES 

The Funds below are currently out of favor, but historically these could possibly Double or more from these lower levels. We are looking for a good Entry Point for these, but need the entire Economy  & Inflation to pick up speed:

BITA   BITA HOLDINGS   Back in the Green Zone on Weekly Chart, but Relative Strength has dumped.
DBC   COMMODITY FUND   Relative Strength is back Below 90.
GRPN   GROUPON INC.    Wait for Break Out above $5.94 on High Volume.
JJC     COPPER FUND           Volume is Super Low.
KOL    COAL FUND         Wait for Break Out above $15.44 on High Volume.
LL   LUMBER LIQUIDATORS   Wait for Money Wave Buy on Weekly Chart.
REMX   RARE EARTH FUND   Wait for Green Zone Buy on the Weekly Chart.
TWTR   TWITTER INC.   Wait on Break Out Above $25.25.
UGA   US GASOLINE FUND     Volume is too low… Broke Out Above $32.03.
VALE   VALE DE RIO    Wait for Break Out above $11.72 on High Volume.

___________________________________________________________________________________________

Click for  Portfolio (Open Positions)  
Click for  Watch List
Click for  Closed Positions


Alert! Market Risk is HIGH (Red Zone). The probability of successful Short Term Trades is lower, when the S&P 500 is Way Above the Green Line. Even the Strongest Funds can get chopped up. Either take quick gains from Money Wave Pops, or STAY IN CASH & WAIT for a larger correction.

Tell your Friends about the Green Line, and Help Animals.


QUESTION:   Kerry writes:

“I am a relatively new member and am curious about the rationale for one of the rules.  As I understand it, to qualify as a buy, a security must close below the the Money Wave (slow stochastic) reading of 20  for at least  one day;  merely dipping below the 20 reading for a part of the day and then breaking out above  it that same day is insufficient to qualify for a buy.  I am curious about the rationale for that distinction. 

Thanks so much in advance,”

ANSWER:

Sometimes the Strongest Investments do not Close on the Green Zone, and take off again. But we need firm Rules to have a System, so we require a Close in the Green Zone.

If many Investments are coming down in the Green Zone together on a Market drop, it is fine to fudge on the Rule (and sometimes better) and Buy the ones that “Tag & Go”.

Just have a Sell Stop Loss Below the trade.

Good trading, and tell your friends!

Related Post

– Green Line Weekly Nov 5, 2017

Subscribe to Our Newsletter

AGL Logo

Get our eBook Now!

Candlestick - A Swing Traders Friend

We don’t spam! Read our privacy policy for more info.

You’ve been successfully subscribed to our newsletter!

Voted #1 at Stock Charts

SH Chart
Inverse S&P 500 Fund (SH) will have a Money Wave Buy today.

Help Us Help Animals

Help Us Help Animals

Recent Comments

  • Market Breadth Indicators: A Trader’s Guide to Early Trend Detection on Backtesting: Definition and How a Trading Strategy Backtest Works
  • Island Reversal Pattern: Definition and Formation Explained on Double Top Pattern: How to Identify and Trade This Reversal Signal
  • Channel Pattern Guide: What It Is and Why It Matters on A Guide to Forecasting Using Moving Averages
  • What Is a Broadening Bottom Chart Pattern? Full Guide on Bull vs. Bear Market: An Investor’s Guide to Market Phases
  • ATGL Weekly Money Flow - 2025-05-11 on ATGL Top Pick of the Week! Apr 6, 2025

Become a Green Liner!

Help me make more Money in the Stock Market.

ON ATGL

  • DashBoard
  • Weekly Commentary
  • Daily Buy / Sell Signals
  • Day Trade Setup
  • Trading Rooms

Design & Develop By Pixelvect

STRATEGIES

  • Swing Trading
  • ATGL Pick of the Week
  • Dividend Growth
  • ETF Sector Rotation
  • Dogs of the Dow

HELP

  • ATGL Trading Rules
  • FAQ
  • Account Maintenance
  • Contact US
  • Join

FOLLOW US

Instagram Linkedin Twitter Facebook

© COPYRIGHT 2024 · ABOVETHEGREENLINE.COM · ALL RIGHTS RESERVED · PRIVACY · TERMS · CONTACT · WATCHLIST · CURRENT