5/23/2021 Markets were mostly lower for the week as the Stock Indices are valued up at historically high levels. This is justified by many because Interest Rates are so low historically because of FED Printing. There are many signs that the Economy is really heating up, so normally T- Bonds would Dump even more than they have already have (down 20% + in the last year). But the FED is still buying $80 Billion of Debt monthly which manipulates the Free Markets of Interest Rates, and gives us a false reading on the strength of the Economy. Now there is talk of the FED cutting back on the Buying of DEBT, which could cause Bonds to dump more and Long Term Interest Rates to rise.
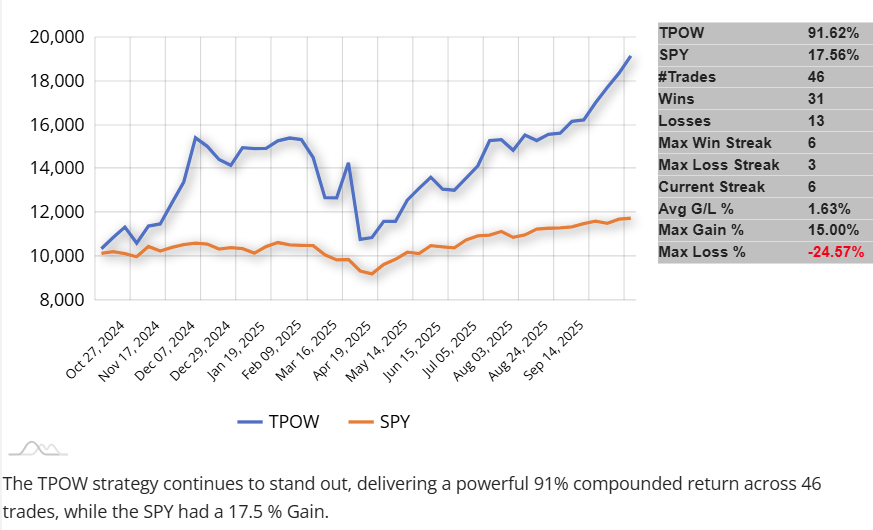
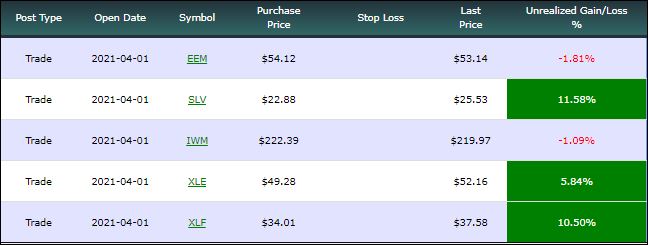
It has been harder to make money this quarter compared to last quarter. So far this quarter the S&P 500 is up 4.5 %, the NASDAQ 100 is up 2% and the ARKK Momentum Fund is down 11.7%. The Stronger Sector Funds are: Financials (XLF + 10.5%), Silver Fund (SLV+11.58%) and the Energy Fund (XLE + 5.84%) which are all in the Green Line ETF Sector Rotation System.
There are several Long Term Investments below that have already corrected 30 % (down near the Green Lines) and should pop back up again. It has become harder to make much Money lately on Swing Trading until these normally bounce back up.
SEE COMMODITY CHARTS Look how strong they are.
For the week the Dow was down 0.44%, the S&P 500 was down 0.39%, and the Nasdaq 100 was up 0.19%. The Long Term Trend for the Indices is up.
The Inflation Index (CRB) was down 1.19% for the week and is Above the Green Line, indicating Economic Expansion.
Bonds were up 0.43% for the week, and are Below the Green Line, indicating Economic Expansion.
The US DOLLAR was down 0.31% for the week.
Crude Oil was down 2.74% for the week at $63.58 and GOLD was up 2.10% at $1876.70.
_____________________________________________________________________________________________
MONEY WAVE BUYS SOON
We are currently in 3 logged Current Positions, for the Short & Medium Term. There are 9 Investments on the Short Term Watch List.
Be patient and WAIT for Green Zone Buy Signals!
______________________________________________________________________________________________
LONG TERM INVESTMENTS (Several Leaders have pulled back, but Markets are on Highs.)
DBC COMMODITY FUND Buy on the next Daily Money Wave Buy Signal with High Volume.
ETSY ETSY INC. Buy if it Closes above $175.14 with High Volume.
FCEL FUELCELL ENERGY INC. Buy if it Closes above the Red Line (50-day avg.) with High Volume.
ICLN GLOBAL CLEAN ENERGY FUND Buy if it Closes above the Red Line (50-day avg.) with High Volume.
LAC LITHIUM AMERICAS FUND Buy if it Closes above the Red Line (50-day avg.) with High Volume.
PENN PENN NATIONAL GAMING Buy if it Closes above the Red Line (50-day avg.) with High Volume.
PLUG PLUG POWER INC. Buy if it Closes $30.34 with High Volume.
RIOT RIOT BLOCKCHAIN Buy if it Closes $26.95 with High Volume.
TAN SOLAR FUND Buy if it Closes above the Red Line (50-day avg.) with High Volume.
TRIP TRIPADVISOR INC. Buy if it Closes above the Red Line (50-day avg.) with High Volume.
TSLA TESLA INC. Buy if it Closes above the Red Line (50-day avg.) with High Volume.
XBI BIOTECH FUND Buy if it Closes above the Red Line (50-day avg.) with High Volume. (Relative Strength is below 80).
______________________________________________________________________________________
Click for Watch Lists
Click for Current Positions
Click for Closed Positions
New: My Trading Dashboard
Day Trading Watch List
NEW Top 100 List May 1, 2021
Dividend Growth Portfolio
ETF Sector Rotation System
Dogs of the DOW System
Long Term Strategy for IRAs & 401k Plans
CNN Fear & Greed Index
Scrolling Stage Chart Investing Charts
Alert! Market Risk is HIGH (Red Zone). The probability of successful Short Term Trades is better, when the % of stocks above the 50-day avg. is below 20.
Tell your Friends about the Green Line, and Help Animals.
___________________________________________________________________________________________
QUESTION: Winter writes ““Don’t take a Loss” confuses me. What does that mean?”
ANSWER: When the Investment has a Money Wave Buy Signal, it should pop up 3-6 % in just a few days.
If it is not popping up well, and the Money Wave > 50, either Get the H out, or Don’t Take a Loss!
Something must be Wrong. There will be plenty more… Raise Cash, and don’t get Stuck! Wait for the next one.
Good trading and tell your friends!
ATGL