
Dividend Growth Master Guide
Building Durable Wealth Through Structured, Rules-Based Dividend Investing
Dividend growth investing is often described as a conservative strategy, but that characterization captures only part of the truth. At its core, dividend growth investing is not about avoiding risk; it is about controlling risk through financial strength, disciplined evaluation, and long-term compounding. It is an approach that favors measurable criteria over prediction and consistency over excitement.
At Above the Green Line, dividend growth investing is treated as a structured system rather than a collection of stock picks. The objective is not simply to receive income, but to build a portfolio capable of increasing its income stream over time while preserving capital and participating in market appreciation. When applied through a systematic framework, dividend growth transforms from a passive tactic into a repeatable wealth-building methodology.
This master guide serves as a comprehensive reference for investors who want more than surface-level definitions. It is designed to be revisited, not skimmed—an evolving handbook that aligns dividend investing principles with portfolio design, behavioral discipline, and long-term financial planning.
This guide is designed to be used like a system manual, not a one-time article. Thresholds and rules in this guide are default ATGL baselines. They should be adjusted by sector characteristics, account type (taxable vs. IRA), and individual risk tolerance—without abandoning trend discipline. If you want the fastest implementation path, start with Key Metrics and Quantifying Dividend Safety, then move directly into the Green Line Screening Lab to build a watchlist. Use the Green Line Overlay and the Hard Exit Rulebook as your ongoing monitoring rules, and revisit Portfolio Construction and Diversification during scheduled quarterly and annual reviews. The objective is simple: reduce improvisation, increase repeatability, and let compounding do the heavy lifting over time.
The Philosophy of Dividend Growth Investing
Dividend growth investing rests on a simple but powerful idea: companies that consistently increase dividends tend to exhibit financial discipline, durable earnings, and management confidence in future performance. These traits often correlate with operational stability and long-term shareholder alignment.
Unlike high-yield chasing, which can lead investors toward distressed businesses or unsustainable payout ratios, dividend growth investing emphasizes sustainability before yield. The investor’s mindset shifts from “How much income today?” to “How reliable and expandable is this income over decades?” This subtle change reframes investing from short-term gratification to long-term durability.
This philosophy encourages patience. It rejects the urgency that dominates many financial headlines and replaces it with structured evaluation. Dividend growth investing does not promise rapid wealth; it promises durable wealth built through compounding and discipline. Investors who adopt this mindset begin to view dividends not as static payments, but as expanding financial momentum tied to corporate strength and time.
The Role of a Structured, Rules-Driven Framework
Dividend growth investing becomes significantly more powerful when paired with a systematic framework. Emotional bias is one of the greatest threats to long-term portfolio performance. By establishing predefined criteria and review intervals, investors reduce impulsive decisions and maintain consistency across market cycles.
A disciplined framework typically emphasizes:
- Consistent screening metrics
- Defined allocation thresholds
- Scheduled portfolio reviews
- Data-driven decision criteria
The goal is not rigidity, but continuity. A structured system ensures that dividend decisions are guided by financial signals rather than sentiment. This structure reduces impulsive buying, prevents panic selling, and reinforces long-term focus. Over time, the cumulative effect of disciplined processes often outweighs the impact of individual stock selections.
At Above the Green Line, the emphasis is not on prediction but preparation. Investors are encouraged to define their evaluation criteria before entering positions, rather than improvising responses during volatility. This approach transforms investing from a reactive activity into a measured, repeatable practice.
Dividend Growth vs. High Yield: Understanding the Trade-Off
The distinction between dividend growth and high yield is one of the most critical concepts in income investing. High-yield stocks often attract attention because they promise immediate income, but elevated yields can signal financial strain, declining earnings, or unsustainable payout ratios. What appears attractive in the present may mask structural weaknesses that threaten long-term continuity.
Dividend growth investing, by contrast, focuses on companies capable of raising dividends year after year, even if their current yield appears modest. Over time, dividend increases can surpass the initial yield advantage of higher-paying but stagnant stocks. The investor trades immediate gratification for expanding income potential.
The trade-off is temporal. High yield delivers faster income today; dividend growth delivers increasing income tomorrow. Investors who understand this dynamic are better equipped to align expectations with financial goals. Rather than chasing the largest payout, they prioritize sustainability, purchasing-power preservation, and long-term expansion.
When High Yield Makes Sense
High yield is not inherently flawed. In certain contexts, it can be entirely appropriate and even strategically advantageous. Investors approaching or already in retirement, for example, may prioritize dependable cash flow over long-term growth acceleration. In these cases, immediate income usability can outweigh the benefits of compounding future dividends.
High yield can also play a complementary role within a diversified portfolio when supported by strong coverage metrics and stable cash generation. Real Estate Investment Trusts (REITs), infrastructure firms, and certain utility companies often maintain higher payout ratios due to predictable revenue streams. When their dividends are backed by sustainable free cash flow and manageable debt, elevated yields may reflect business structure rather than distress.
The key distinction is earned yield versus inflated yield. Earned yield arises from stable operations and durable cash flow. Inflated yield often results from falling share prices driven by deteriorating fundamentals. Without disciplined screening, the two can look identical on the surface while representing vastly different risk profiles.
Why Dividend Growth Often Wins Over Time
Dividend growth investing tends to outperform high-yield chasing over extended horizons because it aligns income expansion with corporate earnings strength. Companies that increase dividends consistently usually exhibit disciplined capital allocation, competitive advantages, and adaptable business models. These attributes compound not only income but also investor confidence.
The long-term advantage becomes most visible when dividend growth intersects with reinvestment. A modest starting yield paired with steady annual increases can produce a significantly higher yield on cost over ten or fifteen years. While the high-yield investor may receive more income early, the dividend-growth investor frequently surpasses that income later—often with stronger capital appreciation and lower volatility.
Dividend growth also provides a built-in inflation hedge. Rising payouts help preserve purchasing power, whereas fixed or stagnant dividends gradually lose real value over time. This characteristic is particularly important during inflationary periods, when static income streams struggle to keep pace with increasing living costs.
Ultimately, dividend growth investing emphasizes trajectory over immediacy. It favors businesses that are expanding their ability to pay shareholders rather than merely maintaining current distributions. When combined with disciplined evaluation and trend confirmation, dividend growth shifts the investor’s focus from short-term yield comparisons to long-term financial durability.
The Mathematics of Compounding Income
Compounding is the quiet force that distinguishes dividend growth investing from transactional trading strategies. Unlike capital gains, which depend on price appreciation and timing, compounding operates through repetition and patience. Each dividend payment, when reinvested, increases share ownership, which in turn increases the next dividend payment. This recursive cycle transforms incremental income into exponential expansion over extended periods.
Consider two investors who each purchase a dividend-paying stock with identical initial capital. One withdraws dividends as cash, while the other reinvests them. After several years, the reinvesting investor owns more shares without contributing additional capital. As dividends continue to rise, the income gap widens, demonstrating that compounding is less about speed and more about persistence multiplied by time.
Compounding also operates through corporate dividend increases, creating dual momentum. The investor benefits not only from additional share accumulation but also from higher payouts per share. When both forces align—reinvestment and corporate growth—the acceleration becomes noticeable, particularly over ten- or twenty-year horizons.
To visualize the long-term impact of these recursive cycles, the following table illustrates the divergence between two investors starting with identical capital, demonstrating how share accumulation and dividend growth create an exponential income gap over a ten-year horizon. After 10 years, the reinvesting investor owns ~50% more shares (155 vs. 100), which becomes a permanently larger dividend base.
| Year | Div. Per Share | Investor A (Shares) | Investor A Income | Investor B (Shares) | Investor B Income |
|---|---|---|---|---|---|
| 0 | $3.00 | 100 | $300.00 | 100 | $300.00 |
| 1 | $3.21 | 100 | $321.00 | 103 | $330.63 |
| 2 | $3.43 | 100 | $343.47 | 106 | $364.08 |
| 3 | $3.68 | 100 | $367.51 | 110 | $404.26 |
| 4 | $3.93 | 100 | $393.24 | 114 | $448.29 |
| 5 | $4.21 | 100 | $420.76 | 119 | $500.95 |
| 6 | $4.50 | 100 | $450.22 | 125 | $562.50 |
| 7 | $4.82 | 100 | $481.73 | 131 | $631.42 |
| 8 | $5.15 | 100 | $515.45 | 138 | $710.70 |
| 9 | $5.52 | 100 | $551.54 | 146 | $800.92 |
| 10 | $5.90 | 100 | $590.14 | 155 | $914.50 |
A modest yield, consistently reinvested, can produce surprising results. The mathematics reveal that the most dramatic expansion often occurs later in the timeline, reinforcing the necessity of patience. Investors who internalize this principle begin to view dividends as building blocks of expanding financial momentum rather than isolated payments.
Long-term perspective is therefore inseparable from compounding. Patience is not passivity; it is active consistency. Structured reviews, periodic rebalancing, and ongoing evaluation remain essential. The strategy is deliberate, not dormant.
Financial Strength and Dividend Sustainability
Dividend growth investing ultimately rests on one central question: Can the company continue to pay and increase its dividend through varying economic conditions? The answer lies not in headlines or short-term price performance, but in the durability of the company’s financial structure.
Balance sheet discipline is one of the most telling indicators. Companies carrying excessive leverage may struggle to maintain dividend growth during interest-rate increases or economic contractions. Manageable debt ratios, by contrast, provide operational flexibility and reduce the likelihood that dividend payments will be sacrificed to preserve liquidity.
Equally important is the consistency of revenue and earnings trends. Dividend growth investing favors businesses that demonstrate stable or gradually expanding earnings rather than volatile profit cycles. Predictable earnings streams allow management to commit to dividend increases with confidence, reinforcing investor trust and signaling operational resilience.
Free cash flow quality provides another essential lens. Dividends are funded by actual cash generation, not accounting adjustments. When free cash flow remains positive and aligned with earnings, it suggests that dividend payments are supported by real operating strength rather than temporary financial maneuvers.
Financial strength is not a single ratio or data point; it is a composite of balance sheet prudence, earnings consistency, liquidity quality, and management discipline. Investors who evaluate these elements collectively gain a clearer understanding of dividend durability.
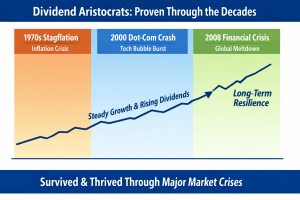
Dividend Aristocrats: The Durability Benchmark
Dividend Aristocrats represent one of the most recognized benchmarks for dividend durability in public markets. The term generally refers to companies that have increased their dividend payouts for 25 or more consecutive years, demonstrating the ability to sustain shareholder returns across multiple economic cycles, interest-rate environments, and market disruptions. This longevity is not accidental; it typically reflects disciplined capital allocation, resilient earnings models, and management teams committed to predictable shareholder policies.
For dividend growth investors, Aristocrats often serve as a starting universe rather than a final decision list. Their multi-decade increase histories signal financial strength, but longevity alone does not guarantee continued momentum or optimal entry timing. Businesses evolve, industries change, and even historically strong companies can enter prolonged periods of stagnation. This is where structured evaluation and technical confirmation add value.
The durability of Dividend Aristocrats becomes most visible not during bull markets, but during periods of economic stress, when weaker companies falter while disciplined dividend growers continue to raise payouts.
Within the Above the Green Line methodology, many Dividend Aristocrats naturally pass the financial durability filters—consistent earnings, manageable payout ratios, and strong free-cash-flow coverage. However, they are still evaluated through the same momentum and safety lenses as any other candidate. The Green Line overlay ensures that investors are not only selecting companies with impressive histories, but also deploying capital when the broader market is actively supporting those businesses.
In practical terms, Dividend Aristocrats illustrate an important principle: dividend growth is a long-term discipline, not a short-term tactic. Their track records demonstrate that sustainable income expansion is built through operational resilience and capital discipline rather than headline yields. When combined with structured screening and trend confirmation, Aristocrat-style durability becomes a powerful foundation for constructing portfolios designed to endure multiple market cycles rather than merely perform well in favorable conditions.
| Attribute | Why It Matters to Dividend Investors |
|---|---|
| 25+ Years of Increases | Demonstrates multi-cycle resilience |
| Large Market Capitalization | Liquidity and institutional ownership |
| Earnings Consistency | Supports predictable payout growth |
| Sector Leadership | Indicates pricing power and competitive moat |
| Broad Shareholder Base | Reduces volatility from concentrated ownership |
Key Metrics for Dividend Evaluation
While philosophy and financial strength provide conceptual grounding, practical evaluation relies on measurable indicators. Dividend growth investing is not guesswork; it is an analytical discipline. The goal is not to find perfection in a single ratio, but to identify alignment across multiple indicators so the dividend is supported by both operating strength and sustainable capital allocation.
Dividend Growth Rate (DGR). The dividend growth rate reflects management’s confidence in future earnings and cash flow. Steady, moderate increases often indicate disciplined capital allocation, while erratic spikes can signal one-time factors or a policy that may not be repeatable. In a rules-based system, the key is not just “growth,” but whether growth is stable across 3-year, 5-year, and 10-year periods.
Dividend Payout Ratio (Earnings-Based). The Dividend Payout Ratio serves as the primary gauge of a company’s distribution sustainability, measuring the exact proportion of net income returned to shareholders. In a disciplined investing framework, this metric reveals the “margin of safety” between a company’s profits and its dividend commitments. A lower ratio suggests that management is retaining sufficient capital to fund future operations, debt reduction, and internal growth, whereas an elevated ratio warns that the dividend may be vulnerable if earnings encounter a temporary shortfall.
While a Dividend Payout Ratio below 60% is generally considered the “Gold Standard” for stability, it must be interpreted through a sector-specific lens. For instance, mature utility companies may safely maintain higher ratios due to their predictable regulated income, whereas high-growth technology firms often keep the ratio low to prioritize reinvestment. When evaluating this metric, the most critical “Red Flag” for the dividend growth investor is a rising payout ratio paired with stagnant earnings—a combination that often precedes a dividend freeze or cut.
Free Cash Flow (FCF) Coverage. Free cash flow remains one of the most practical dividend metrics because dividends are funded by liquidity, not accounting profits. When free cash flow is consistently positive and reasonably aligned with earnings, it suggests the dividend is supported by real operating strength rather than temporary financial maneuvers. When FCF coverage weakens for multiple quarters, dividend “safety” can deteriorate even if the dividend has not yet been cut.
Yield (Context Matters). Yield is the most visible metric — and the most commonly misunderstood. A high yield may reflect a generous payout policy, but it can also reflect price decline due to business deterioration. In the ATGL framework, yield is interpreted through the trend filter: a rising yield caused by falling price while the stock is below the Green Line often signals a potential yield trap rather than an opportunity.
Yield on Cost (YOC). Yield on cost illustrates compounding over time by measuring dividend income relative to the original purchase price. Long-term holders often see their effective yield expand substantially over years of disciplined ownership. Yield on cost should not be used for new buy decisions, but it is useful for reinforcing the power of patience, reinvestment, and dividend growth acceleration.
Earnings and Revenue Stability. Earnings stability provides context to all other indicators. When revenue and profits remain consistent, the probability of dividend continuity increases. Dividend growth investing favors businesses with predictable earnings streams rather than highly volatile profit cycles, because predictability enables management to raise dividends with confidence.
Two Practical “Conflict Rules” (When Metrics Disagree)
Because no metric works in isolation, investors should apply simple interpretation rules when signals conflict:
Rule 1: High Yield Must Earn Its Place.
If yield is high but payout ratios are rising or free cash flow coverage is weakening, treat the stock as a caution candidate, not a bargain. The higher yield may be compensating you for hidden risk.
Rule 2: The Best Candidates Look “Boring” on Purpose.
A moderate yield paired with strong FCF coverage, stable payout ratios, and consistent dividend growth is often the most durable compounding combination — especially when the stock is Above the Green Line. In dividend growth investing, the winners usually look stable before they look exciting.
No single metric guarantees success, but when multiple indicators align — durability, coverage, and stability — confidence in dividend sustainability increases substantially.
Quantifying Dividend Safety: The Mathematical Filter
A master guide requires precise mathematical triggers to remove ambiguity. At Above the Green Line, we utilize a tiered calculation system to verify that a dividend is not just paid, but fortified.
The Dividend Coverage Ratio (DCR)
The first line of defense is the Dividend Coverage Ratio. This measures the number of times a company can pay its current dividend out of its net income. In a rules-based system, a DCR above 2.0 (meaning earnings cover the dividend at least twice, roughly a payout ratio at or below 50%) is considered strong for most sectors. We calculate it as:
$$\text{Dividend Coverage Ratio} = \frac{\text{Net Income}}{\text{Annual Dividends Paid}}$$
The Free Cash Flow (FCF) Payout Filter
Because net income can be influenced by non-cash accounting items, the “Golden Rule” of dividend safety is the FCF Payout Ratio. This tells us how much of the actual “cold hard cash” generated by the business is being sent to shareholders. We prefer to see this stay below 60% to allow for “Internal Reinvestment” and “Debt Reduction.”
$$\text{FCF Payout Ratio} = \frac{\text{Dividends per Share}}{\text{Free Cash Flow per Share}}$$
Where Free Cash Flow is defined as:
$$\text{FCF} = \text{Operating Cash Flow} – \text{Capital Expenditures}$$
The Dividend Growth Acceleration Rule
We don’t just look for growth; we look for the rate of change in growth. A company whose dividend growth rate is decelerating (e.g., 10% last year, 5% this year, 2% currently) is a company that is likely moving toward a “Green Line Violation.” A rules-based investor monitors the 3-year, 5-year, and 10-year Compound Annual Growth Rates (CAGR) to ensure the trajectory remains stable.
Once dividend safety is quantified, the next step is deployment discipline. Many investors stop after identifying “good companies,” but a rules-based system also requires timing and structure. The Screening Lab converts safety and durability into a watchlist and a repeatable entry process—so capital is deployed into companies that are both financially qualified and supported by institutional momentum.
The Green Line Screening Lab: From Market Universe to Elite Watchlist
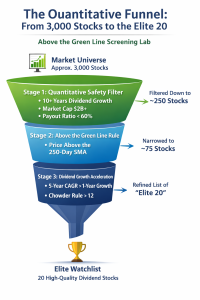
Before analyzing individual companies, the ATGL framework begins with a structured reduction process designed to filter thousands of stocks into a manageable list of elite candidates.
The efficacy of a dividend growth strategy is determined at the point of entry. In a rules-based system, we do not hunt for stocks based on news cycles or “hot tips”; instead, we utilize a quantitative funnel to distill the thousands of available equities down to a concentrated list of institutional-quality compounders. This screening process ensures that every position in the portfolio has earned its place through measurable financial strength and confirmed price momentum.
Stage 1: The Quantitative Safety Funnel
The first step in the screening process is to eliminate the “noise” by applying hard fundamental filters. Many Dividend Aristocrats naturally pass Stage 1 due to their multi-decade dividend increase histories. We begin with the broad market and apply the following baseline criteria:
- Dividend Longevity: A minimum of 10 consecutive years of dividend increases. This filters for companies that have navigated at least one minor economic cycle without compromising shareholder returns.
- Market Capitalization: A minimum of $2 billion (Mid-Cap and above). This ensures sufficient liquidity and institutional interest, which is vital for the “Green Line” technicals to be meaningful.
- Payout Ratio Ceiling: A maximum earnings payout ratio of 60% (sector-adjusted). This provides the “Safety Buffer” required to sustain the dividend during a temporary earnings contraction.
Stage 2: The “Above the Green Line” Momentum Filter
Once a list of fundamentally safe companies is established, we apply the primary technical rule: Price must be trading Above the Green Line (250-day Simple Moving Average). Many investors make the mistake of buying “value” stocks that are in a technical death spiral. By requiring the stock to be Above the Green Line, we confirm that institutional accumulation is occurring. If a stock meets all fundamental criteria but is trading below its 250-day SMA, it is placed on a “Dormant Watchlist” and is not eligible for purchase until it reclaims the line with volume confirmation.
Stage 3: The Dividend Growth Acceleration (DGA) Score
The final stage of the lab is ranking the remaining candidates. We utilize a proprietary scoring method that looks for Acceleration rather than just growth. A company that raised its dividend by 5% last year but 8% this year is showing operational momentum that the market often hasn’t fully priced in yet.
- The 5-Year CAGR vs. 1-Year Growth: If the 1-year growth rate is higher than the 5-year average, the stock receives a “High Priority” rank.
- The Chowder Rule Integration: We sum the current dividend yield and the 5-year dividend growth rate. For stocks Above the Green Line, we look for a “Chowder Number” of 12 or higher (8 for Utilities).
- $$\text{Chowder Number} = \text{Current Yield} + \text{5-Year Div. Growth Rate}$$
Stage 4: Defining the “Buy Zone”
The Screen Lab doesn’t just tell us what to buy, but where and how to deploy capital. A stock trading 15%–25% above its Green Line may still be a great company — but it can also be an inefficient entry that increases drawdown risk and reduces long-term yield on cost. Our rules-based approach favors entry efficiency: buying when long-term support is close enough to act as a structural floor.
The Rule of Proximity: The optimal “Buy Zone” is defined as a stock trading within 5% of its Green Line (250-day SMA) while maintaining its fundamental DGA score. This minimizes gap risk and increases the probability that normal volatility does not immediately turn into a multi-month recovery.
To keep execution consistent, the Buy Zone is interpreted using three simple conditions:
- Extended (More than ~10% above the Green Line):
Action: Do not initiate a full position. Add to the watchlist and wait for mean reversion. Dividend quality does not eliminate valuation and timing risk. - Eligible (Within ~5% of the Green Line):
Action: Initiate a starter tranche (partial position) if fundamentals remain intact and price stabilizes. This is the highest-quality entry zone because technical support is close and institutional trend is intact. - Undershoot (Briefly below the line, then recovers):
Action: Treat as a watchlist confirmation event, not an automatic buy. Require recovery evidence (trend reclaim + stabilization). If the line is reclaimed quickly and safety metrics remain stable, the stock may re-enter the eligible zone.
This stage converts “good companies” into disciplined entries. The objective is not perfect timing — it is repeatable deployment that reduces regret, improves entry efficiency, and keeps dividend capital aligned with durable businesses the market is actively supporting.
The Technical “Green Line” Overlay: Timing, Momentum, and Capital Protection
Fundamental analysis helps you identify what to own. Technical analysis helps you decide when to deploy capital and when to protect it. For dividend growth investors, timing is often ignored because the strategy is framed as “buy quality and hold forever.” In practice, however, poor timing can turn a stable income plan into a multi-year recovery project, particularly when investors “reach for yield” during sustained downtrends.
At Above the Green Line, the Green Line overlay functions as a market-based confirmation layer. It does not replace dividend safety analysis; it reinforces momentum discipline so capital is more likely to remain in assets the market is actively rewarding. This matters because dividend growth investing is ultimately a total return strategy — rising dividends matter most when they are paired with intact principal and steady appreciation.
Defining the Green Line (ATGL Interpretation)
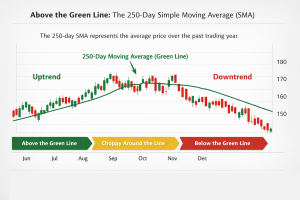
Before exploring how the Green Line is applied for entries and exits, it is helpful to see what the indicator looks like on a real price chart.
Within the Above the Green Line framework, the Green Line is defined as the 250-day Simple Moving Average (SMA) — approximately one full trading year of price data. The line itself is not mystical or predictive; its value lies in what it represents. Over the span of a year, the stock has moved through earnings cycles, interest-rate decisions, sector rotations, and macroeconomic shifts. The 250-day average therefore becomes a practical approximation of the market’s long-term consensus cost basis.
When price consistently remains above the 250-day SMA, the market is generally communicating:
- The long-term trend is intact
- Institutional demand is absorbing supply
- Capital is flowing toward the asset rather than away from it
When price breaks below the line and remains there, the message often shifts toward distribution, re-rating, or structural uncertainty. The Green Line therefore acts as a trend filter, not a prediction tool.
The Trend–Yield Paradigm: Avoiding the Yield Trap
One of the most common errors in dividend investing is purchasing a stock solely because the yield appears attractive. The yield may be elevated not because the company improved, but because the price declined — sometimes for very good reasons. A stock trading materially below its 250-day SMA can be signaling weakening margins, shrinking free cash flow, rising leverage, or a likely dividend freeze.
The Green Line overlay forces the correct question:
Is this a high-quality dividend company temporarily discounted, or is the market repricing a deteriorating business?
By requiring price to remain Above the Green Line for new entries, investors reduce the probability of committing capital into prolonged downtrends where dividends may continue briefly while principal impairment accelerates.
Why Dividend Investors Still Need Technical Timing
Dividend growth investing is a long-duration strategy — and that is precisely why timing matters. A poor entry can create extended periods of “dead capital,” where dividends are collected but principal spends years recovering. In the worst cases, investors emotionally capitulate near lows, converting temporary drawdowns into permanent losses.
The Green Line overlay is not about perfect timing. It is about avoiding the worst deployment zones, where trends are broken and dividend safety may be transitioning from reliable to questionable. It provides structure rather than precision.
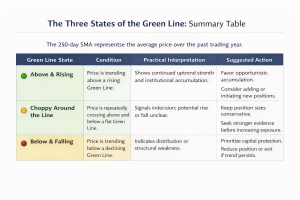
Three Practical Green Line States
The Green Line can be interpreted in three straightforward conditions:
- Above and Rising — Preferred Condition
This is the ideal dividend growth environment. The stock is trending upward, institutions are accumulating, and pullbacks tend to be orderly rather than chaotic. - Choppy Around the Line — Neutral / Caution Zone
Repeated crossings above and below the line indicate market indecision. Position sizes should remain conservative, and stronger fundamental confirmation is warranted. - Below and Falling — Avoid / Reduce Condition
This is where yield traps frequently reside. The dividend may still be paid, but the market is signaling structural weakness or declining confidence. Opportunity cost and downside risk increase.
The table below provides a quick-reference summary of these three Green Line conditions and their strategic implications.
The Entry Protocol: Pullbacks to the Line
Dividend growth positions are rarely optimal when entered during vertical price surges. A disciplined approach seeks structured pullbacks while the long-term trend remains intact. The most favorable entries often occur when price retraces toward the Green Line and begins to stabilize, indicating that selling pressure is being absorbed.
High-probability entries typically exhibit four characteristics:
- Price remains above the 250-day SMA
- Pullback volume is lighter than the preceding advance
- Dividend safety metrics remain stable
- Daily price ranges begin to tighten near support
The Green Line therefore becomes a repeatable deployment zone rather than an emotional decision point.
Numerical Illustration: Entry Timing and Yield on Cost
Two investors may select the exact same dividend-growing company, yet achieve meaningfully different long-term income outcomes based solely on their entry price. The difference is not speculation; it is timing discipline within an established trend.
Imagine a company offering a 3% starting yield with a 7% annual dividend growth rate. Investor A purchases during a price surge far above the Green Line, while Investor B waits for a controlled pullback closer to long-term support.
Both investors hold the stock for ten years. The dividend per share rises to approximately $5.90. However, because Investor B entered at a lower price, their effective yield differs:
- Investor A: $100 entry → Yield on Cost ≈ 5.9%
- Investor B: $85 entry → Yield on Cost ≈ 6.9%
The dividend did not change — the entry efficiency did. Over large portfolios and extended horizons, this difference compounds into a substantial income advantage. The objective is not perfect timing, but measured entry within a prevailing uptrend.
Position Building: Tranches Instead of “All In”
To keep the process systematic, consider incremental position building:
- Starter Position: Initiate near the Green Line after stabilization
- Add-On #1: Increase allocation after trend resumes and resistance is reclaimed
- Add-On #2: Add following a successful higher-low retest
This approach reduces regret and aligns capital expansion with confirmed strength rather than assumption.
Practical Green Line Entry Scenarios
| Scenario | Price Behavior | Dividend Safety Context | Strategic Interpretation |
|---|---|---|---|
| Support Stabilization | Price consolidates near the line | Fundamentals intact | Disciplined accumulation opportunity |
| Temporary Undershoot | Brief dip below, rapid recovery | Safety metrics stable | Short-term volatility, not structural weakness |
| Sustained Breakdown | Multiple closes below | Metrics weakening | Elevated risk; reassessment warranted |
These are deployment filters, not short-term trading signals. Their purpose is to distinguish routine fluctuations from genuine trend deterioration.
The Dividend Investor’s Green Line Checklist
To keep the overlay actionable without over-complexity:
- Is the 250-day SMA rising or flat?
- Is price holding above it?
- Did the pullback occur with controlled volatility?
- Are payout and free cash flow metrics stable?
- Are price ranges tightening near support?
A majority of “yes” answers suggests a favorable capital-deployment environment.
Closing Perspective
Dividend growth investing succeeds because it combines quality, sustainability, and time. The Green Line overlay adds a fourth element: trend discipline. It reduces the probability of yield traps, improves entry efficiency, and provides a clear framework for capital protection when momentum breaks.
Within the Above the Green Line methodology, the Green Line is not a trading gimmick. It is a long-term guardrail designed to keep dividend investors aligned with institutional accumulation and away from prolonged downtrends where compounding stalls.
Note on exits: The Green Line concepts above provide the trend-based early warning system for when a dividend position may be losing structural support. The full decision framework—including mandatory triggers, safety deterioration thresholds, and systematic reallocation rules—is detailed in the “Hard Exit” Rulebook: Protecting the Dividend Engine section.
| Component | Primary Purpose | Timing Nature | Action Type |
|---|---|---|---|
| Green Line Overlay | Identify trend strength and early warning of momentum shifts | Preventive / Probabilistic | Position review, sizing adjustment, caution on new entries |
| Hard Exit Rulebook | Protect capital when structural or financial deterioration is confirmed | Definitive / Rule-Triggered | Partial reduction or full liquidation |
Sector-Specific Rulebooks: Refining the Systematic Lens
Dividend metrics are not one-size-fits-all. In a structured investing environment, “safety” depends on how an industry generates cash flow and finances growth. The following sector-specific rulebooks adjust the baseline thresholds so your system remains accurate without becoming complicated. These rules modify thresholds — they do not override trend discipline.
- Real Estate Investment Trusts (REITs): The Cash Flow Standard
Standard accounting (GAAP) is often misleading for REITs because “Net Income” includes heavy depreciation charges on physical property. This makes the standard Payout Ratio appear artificially high, often exceeding 100%, which would falsely trigger a sell signal in a basic system.
- The Rule: Replace Net Income with Adjusted Funds From Operations (AFFO). AFFO provides a more accurate picture of the cash available for distribution after maintaining properties.
- The Above the Green Line Threshold: A sustainable REIT typically maintains an AFFO Payout Ratio between 70% and 85%.
- The Formula:
$$\text{AFFO Payout Ratio} = \frac{\text{Dividends per Share}}{\text{AFFO per Share}}$$
- The Technology Sector: Growth-Augmented Dividends
Technology companies often have lower initial yields but much higher Dividend Growth Rates (DGR). In this sector, the Green Line is particularly sensitive to innovation cycles.
- The Rule: Prioritize the “Rule of 40” and Free Cash Flow margins. A tech company must be able to fund its R&D (Research and Development) entirely from operating cash flow while still increasing the dividend.
- The Above the Green Line Threshold: Because tech is cyclical, we require a much lower Payout Ratio (under 40%) to ensure a “Cash Cushion” for periods of rapid industry transition.
- The Momentum Trigger: Tech stocks often lead the market; a cross below the Green Line in this sector is frequently a leading indicator of a broader market shift.
- Utilities and Infrastructure: The Debt-to-Equity Guardrail
Utilities are the “defensive anchors” of a dividend portfolio. They are permitted higher payout ratios due to their regulated, predictable cash flows, but they are highly sensitive to interest rates.
- The Rule: Monitor the Interest Coverage Ratio. Since utilities carry massive debt for infrastructure, rising interest rates can “crowd out” the dividend.
- The Formula:
$$\text{Interest Coverage Ratio} = \frac{\text{EBIT}}{\text{Interest Expense}}$$
- The Above the Green Line Threshold: We look for an Interest Coverage Ratio of 3.0x or higher. If this ratio falls while the stock is testing the Green Line, it signals a fundamental risk to the dividend’s growth trajectory.
The Master Integration: Building the Tiers
By applying these sector-specific rules, the investor can categorize their holdings into a “Tiered Allocation” model:
- Core Tiers (60%): High-moat Consumer Staples and Utilities with low Green Line volatility.
- Growth Tiers (25%): Technology and Healthcare with high DGR and low payout ratios.
- Income Tiers (15%): REITs and MLPs (Master Limited Partnerships) for yield maximization, governed by AFFO rules.
This structured layering ensures that a weakness in one sector—such as a spike in interest rates affecting Utilities—does not compromise the momentum or safety of the entire portfolio.
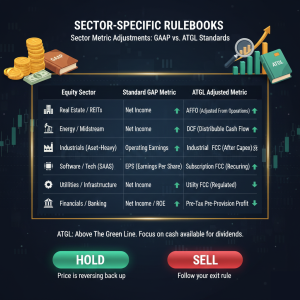
Successful dividend growth investing requires moving beyond a “one-size-fits-all” analysis. Standard GAAP (Generally Accepted Accounting Principles) metrics, such as Net Income and EPS, often fail to account for the unique capital structures and non-cash accounting charges inherent in different industries. To find the “true” cash available for dividends, we apply ATGL Adjusted Metrics.
This table outlines the necessary pivots for high-conviction analysis:
- REITs & Energy: We bypass Net Income (which is skewed by heavy depreciation) in favor of AFFO and DCF to measure actual cash profitability.
- Asset-Heavy Industrials: We prioritize Industrial FCC (Fixed Charge Coverage) after capital expenditures to ensure maintenance costs aren’t eating the dividend.
- Tech & Software: We focus on the quality of recurring subscription cash flows rather than volatile quarterly earnings.
- Financials: We utilize Pre-Tax Pre-Provision Profit to evaluate the bank’s core operating strength before accounting for loan loss reserves.
By using the correct metric for the correct sector, you avoid “Value Traps” that appear profitable on paper but are cash-poor.
Portfolio Construction and Diversification
Dividend growth investing achieves its full potential only when individual stock selection is integrated into deliberate portfolio architecture. Without design, diversification becomes accidental; with design, it becomes intentional and protective.
Position Sizing and Allocation Logic
Diversification is not only about the number of holdings; it is about the weight each holding carries. Even a portfolio with twenty positions can become concentrated if a single stock represents a disproportionate percentage of capital. A practical safeguard is to define a maximum exposure threshold for any individual company. Many disciplined investors limit single-stock allocation to approximately 5–7% of total portfolio value, with higher concentrations reserved only for exceptional conviction supported by both fundamental strength and sustained technical confirmation.
Allocation tiers further reinforce balance. A portfolio may be structured with core holdings—companies with long dividend histories, stable earnings, and low Green Line volatility—paired with satellite positions that offer higher growth potential but slightly higher variability. This tiered approach allows investors to pursue expansion without allowing optimism in a single idea to overshadow portfolio stability. Position sizing therefore becomes a behavioral guardrail as much as a mathematical one; it prevents overconfidence from turning a strong thesis into an outsized risk.
Rebalancing Cadence and Structural Maintenance
Diversification is not a one-time decision; it is an ongoing maintenance process. Over time, strong performers naturally grow into larger allocations while weaker positions shrink. Without periodic review, a portfolio can drift away from its intended structure. A practical cadence often consists of a quarterly light review and an annual deep review.
Quarterly reviews focus on trend states, dividend safety metrics, and sector balance. These are not full restructurings but brief structural check-ins designed to identify early imbalances. Annual reviews, by contrast, examine allocation tiers, sector weightings, and watchlist comparisons in greater depth. This layered cadence aligns naturally with behavioral discipline by replacing emotional reactions with scheduled evaluation windows. Instead of responding to every market movement, investors respond to predefined review intervals, preserving both structure and psychological stability.
Sector and Geographic Balance
Balance begins with sector distribution. Concentrating heavily in traditionally high-yield industries may increase vulnerability to regulatory or commodity-driven shocks. Spreading exposure across defensive, cyclical, and growth-oriented sectors creates a stabilizing effect that reduces correlation risk.
Geographic diversification broadens opportunity sets and mitigates risks tied to a single economy. Even modest international exposure can smooth regional volatility and enhance resilience, particularly when economic cycles diverge across regions.
ETF Versus Individual Stock Selection
Exchange-traded funds and individual stock selection are not mutually exclusive; they are complementary tools serving different purposes. ETFs can provide efficient diversification, particularly for investors with smaller account sizes, limited research time, or a preference for broad market exposure. They reduce single-company risk and can simplify portfolio management while still delivering dividend growth characteristics through diversified holdings.
Individual stock selection, however, adds value when investors possess a structured screening process and the discipline to apply it consistently. Within the Above the Green Line methodology, stock selection allows for targeted exposure to companies that meet precise financial durability and momentum criteria. A balanced portfolio may therefore blend ETFs for broad stability with individual equities for selective growth and income acceleration. The decision is less about preference and more about resource alignment—time, expertise, and tolerance for active evaluation.
Tax Location Awareness
Portfolio construction also benefits from basic tax-location awareness. Certain dividend-producing assets, such as real estate investment trusts, often generate income that may be less tax-efficient in taxable accounts. Placing these holdings in tax-advantaged accounts can enhance net yield without altering investment selection. Conversely, qualified dividend stocks held in taxable accounts may offer favorable treatment depending on jurisdiction. While tax strategies vary by individual circumstances, even modest awareness of asset placement can incrementally improve long-term portfolio efficiency without increasing risk or complexity.
Ultimately, diversification is not about complexity; it is about intentional balance. A well-constructed dividend portfolio resembles an engineered system—each component contributes to overall stability, and every adjustment is guided by measurable criteria rather than sentiment.
A well-built portfolio reduces risk through diversification and sizing, but structure alone does not eliminate deterioration. Even high-quality dividend companies can weaken over time, and trends can break before fundamentals show up in headlines. That is why ATGL pairs portfolio architecture with a non-negotiable exit framework—so capital protection remains systematic rather than emotional.
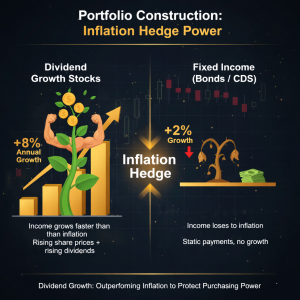
This visual comparison demonstrates the critical difference between “yield” and “growth” in an inflationary environment. While both assets provide income, their long-term impact on your purchasing power is vastly different:
- Dividend Growth Stocks: Represented by the robust, muscular plant, these companies increase their payouts over time (e.g., +8% annually). This creates a “Power Hedge” where your income grows faster than the rising cost of goods, protecting your standard of living and driving share price appreciation.
- Fixed Income (Bonds/CDs): Represented by the wilting plant, these assets offer static payments. Even with a modest yield, a lack of growth means the real value of your income is eroded by inflation over time. What buys a steak today may only buy a loaf of bread in a decade.
The goal of the ATGL Strategy is to ensure your portfolio acts as a living, growing organism that outpaced inflation, rather than a fixed contract that slowly loses its potency.
The “Hard Exit” Rulebook: Protecting the Dividend Engine
While the primary goal of this strategy is the long-term accumulation of shares and income, a “buy and ignore” approach creates a dangerous vulnerability to capital impairment. If a company’s stock price collapses or its business model fails, the “yield” you are receiving is often outweighed by the loss of your principal. At Above the Green Line, we use a rules-based exit strategy to ensure we only hold the “elite” of the dividend world.
A structured exit framework removes the emotional trap of “hoping for a turnaround” by defining objective conditions under which capital should be reassessed or redeployed. These rules are not designed to encourage frequent trading; their purpose is to prevent multi-year stagnation and keep capital aligned with assets the market continues to reward.
- The Dividend Cut: The Automatic “Kill Switch”
The most fundamental rule in our system is the Mandatory Liquidation upon a dividend cut or freeze.
- The Logic: A dividend cut is a confession from management that the company’s cash flow can no longer support its obligations. In almost every historical case, a dividend cut is followed by a significant and sustained drop in share price.
- The Rule: If a company announces a reduction in its dividend, the position is sold immediately, regardless of the current price. We do not “wait for a recovery.” We reallocate that capital into a healthy company that is still Above the Green Line.
- The Technical Exit: The Double-Close Rule
Dividend growth stocks are not immune to bear markets or secular industry declines; it fails when investors hold through extended downtrends that quietly erode principal. We use the 250-day Simple Moving Average (The Green Line) as our structural guardrail.
- The Logic: Institutional investors—the “smart money”—typically begin exiting a position long before a dividend cut is officially announced. This exit shows up in the price action first.
- The Rule: If a stock price sustains two consecutive weekly closes Below the Green Line, the technical thesis is broken. By selling here, we often avoid the “catastrophic tail risk” of a 30% to 50% loss. We are not “market timing”; we are following a trend-following rule that keeps our capital in assets that the market is currently valuing upward.
- The “Safety Cross”: Fundamental Convergence Warning
Sometimes a company stays Above the Green Line, but its “internal vitals” begin to rot. We monitor the Safety Cross, which is the intersection of a rising Payout Ratio and declining Free Cash Flow.
- The Logic: If a company is paying out 95% of its earnings and its debt is increasing to cover the check, the dividend is a “phantom.” It is only a matter of time before the price falls to reflect this reality. The Safety Cross is your early warning system to exit while the stock is still trading at a premium, rather than waiting for the “crash” that follows a fundamental breakdown.
- The Rule: We exit or reduce a position if the Free Cash Flow Payout Ratio exceeds our sector-specific thresholds (e.g., 90% for a standard corporation) for three consecutive quarters. We prefer to exit while the stock is still trading at a premium rather than waiting for the “crash” that follows a fundamental breakdown.
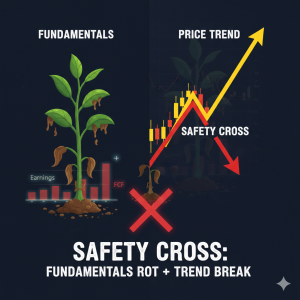
The Safety Cross occurs when fundamental health and price momentum move in opposite directions. This visualizes the moment the market finally “prices in” the internal rot the balance sheet has been hiding. By identifying this intersection, you can protect your principal before a dividend cut, or a catastrophic price collapse occurs.
- Opportunity Cost and Reallocation
Dividend growth investing is not just about receiving a check; it is about the compounding velocity of those checks. If you hold a “zombie” stock that has not raised its dividend in years and is barely hugging the Green Line, that capital is underperforming its potential. In a rules-based system, capital is a finite resource, and compounding requires active momentum.
- The “Strength Ranking” Rule: We perform an annual (or semi-annual) audit to compare current holdings against the “Above the Green Line” Watchlist. A position is a candidate for rotation if it simultaneously meets three “weakness” criteria:
- Chowder Rule Failure: The combined score ($Yield + 5\text{-Year Dividend Growth Rate}$) falls below the sector-specific threshold (e.g., < 12 for most stocks).
- Momentum Stagnation: The stock remains in the “Choppy/Neutral” zone or repeatedly fails to hold the Green Line while the broader sector is “Above and Rising.”
- Superior Alternative: A Watchlist candidate exists with significantly stronger momentum, a higher safety score, and better growth prospects.
The Strategic Outcome: This is not “trading”; it is systematic reallocation. By rotating capital from laggards into “stronger athletes,” you ensure the portfolio is always populated by companies with the highest probability of delivering both increasing income and capital appreciation.
The objective is simple: dividends alone do not justify holding a declining asset. By combining technical structure with fundamental vigilance, investors maintain alignment with both income sustainability and principal protection—ensuring that the dividend engine continues to compound rather than merely persist. We redeploy capital where it is treated best, maintaining the integrity and upward momentum of the Above the Green Line philosophy.
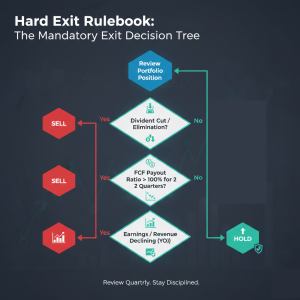
This systematic flowchart serves as the final arbiter for portfolio retention. By stripping away emotional bias and market noise, the decision tree forces a binary outcome—Sell or Hold—based on the three primary “Hard Exit” triggers:
- Dividend Integrity: Any cut or elimination results in an immediate liquidation.
- Cash Flow Solvency: A Payout Ratio exceeding 100% of Free Cash Flow for two consecutive quarters indicates an unsustainable distribution.
- Fundamental Trajectory: Declining year-over-year revenue and earnings signal structural decay.
Only positions that navigate these “No” pathways successfully earn the right to remain in the portfolio. Use this tool during your scheduled quarterly reviews to ensure your capital remains allocated only to the most durable dividend growers.
Reinvestment Strategy vs. Income Distribution
At some point, every dividend investor faces a practical fork in the road: should dividends be reinvested to accelerate compounding, or should they be withdrawn as spendable income? Dividend reinvestment is the practice of using dividend payments to purchase additional shares, expanding the compounding base over time. A well-defined reinvestment strategy determines whether dividends accelerate long-term compounding or serve as immediate income. Both paths can be correct. The right answer depends less on market forecasts and more on your timeline, cash-flow needs, tax situation, and temperament. In the Above the Green Line approach, the key is not choosing one forever—it is defining a dividend “policy” that matches your stage of life, and then executing it consistently rather than improvising the decision each quarter.
Reinvestment is the engine of long-range growth. When dividends are reinvested, each payment purchases additional shares, which increases future dividend payments, which purchases even more shares. The compounding effect is not linear; it becomes more powerful as time passes because the reinvestment base keeps expanding. This is why dividend growth investing is often misunderstood by newer investors. The early years can feel quiet—dividends seem small compared to principal. The real acceleration typically shows up later, when a larger share count combines with a higher dividend per share. In other words, reinvestment is a commitment to building an income stream that is designed to grow for decades, not a tactic for immediate gratification.
Income distribution is the cash-flow alternative. Instead of converting dividends into more shares, the investor treats dividends as a reliable stream of liquidity—money that supports lifestyle spending, lowers dependence on selling assets, or reduces sequence-of-returns risk during retirement. For many investors, this approach becomes more valuable as they move closer to financial independence or retirement, when the primary objective shifts from accumulation to stability. The psychological benefit is real: investors who can fund part of their lifestyle through cash flow often feel less pressure to “time the market” or sell during volatility. The trade-off is that withdrawals reduce share growth, which can slow future income expansion, especially if the income stage starts too early.
A helpful way to think about this decision is that reinvestment optimizes for income growth, while distribution optimizes for income usability. Neither is “better.” They simply serve different priorities. The mistake is allowing the decision to be accidental. Many investors reinvest by default through DRIP and never revisit the decision. Others take dividends in cash because it “feels like profit,” without recognizing that they may be starving the compounding engine during their best accumulation years. A master guide perspective treats dividend handling the same way you treat stock selection: you define what you’re trying to achieve, then you choose the mechanism that supports it.
The three-stage dividend policy: build, transition, live on it
Most investors do not stay in one mode forever. A practical dividend plan often moves through three phases.
During the accumulation phase, dividends are typically reinvested automatically or redeployed deliberately. The goal is to grow the asset base, increase share count, and raise future income capacity. This is the period where dividend growth investing shines, because time is the compounding ingredient you cannot replace later. Even modest dividends become meaningful if reinvested consistently across long time horizons.
During the transition phase, many investors adopt a hybrid approach. They continue reinvesting some dividends while directing a portion to cash reserves. This phase can begin several years before retirement or a financial independence milestone. The purpose is twofold: first, to reduce the shock of moving from reinvestment to withdrawals; second, to build a “cash runway” that allows the portfolio to withstand market downturns without forced selling. In practice, this phase often produces better behavioral outcomes because it creates visible cash flow while keeping compounding partially alive.
During the income phase, dividends become a dedicated cash-flow stream. Some investors take dividends entirely as income. Others still reinvest opportunistically, especially when markets are depressed and valuations are attractive. In the ATGL mindset, the income phase is not an excuse to abandon monitoring; it is a shift in priority. The objective becomes sustaining cash flow while preserving principal. This is where exit discipline and dividend safety monitoring matter most, because portfolio mistakes can directly impact lifestyle support.
Reinvestment method matters: DRIP vs. controlled redeployment
Reinvestment is not a single behavior. There are two common implementation paths, and each has pros and cons.
A DRIP (Dividend Reinvestment Plan) reinvests dividends automatically into the same security that paid them. DRIP can be effective because it removes friction and ensures consistency. It is particularly useful for investors building positions in broad dividend ETFs or high-quality long-term compounders. However, DRIP can also reinvest dividends into positions that are no longer the best use of capital. If a stock becomes extended, loses momentum, or shows weakening dividend coverage, automatic reinvestment can quietly increase exposure at the wrong time.
The alternative is controlled redeployment, where dividends collect as cash and are periodically allocated into the best available opportunities in your watchlist. This method requires a little more attention, but it allows dividend cash flow to become a strategic asset rather than an automatic reflex. It also aligns with the ATGL concept of keeping capital pointed toward strength. A simple cadence—monthly or quarterly redeployment—often provides the best balance between discipline and simplicity. The important principle is that you avoid turning dividend cash into a permanent “cash drag” that sits idle for too long.
A short numerical example: the long-term cost of starting income too early
Consider an investor with a $250,000 dividend growth portfolio producing a 3% starting yield ($7,500/year) and growing dividends at 7% annually. If the investor reinvests dividends for 10 years, the share base and dividend per share both rise, which meaningfully increases the future income stream. If the investor instead withdraws dividends as cash for 10 years, the income is usable today, but the future income base is smaller because share count did not expand.
This example is intentionally simple, but the principle is powerful: taking income earlier than necessary can reduce the compounding runway. The impact often becomes obvious only later, when the investor reaches the stage where they actually need the income and realizes the portfolio’s dividend growth capacity could have been materially higher. That doesn’t mean “always reinvest.” It means you should align the policy with the timeline. If you don’t need the cash flow, reinvestment typically creates a stronger future position.
The real risk isn’t yield — it’s sequence and forced selling
One reason income distribution becomes attractive later in life is that it can reduce reliance on selling shares during market downturns. In retirement, the greatest hidden danger is often sequence-of-returns risk: a bad market early in the withdrawal period can permanently damage a portfolio’s ability to recover. Dividend income can serve as a partial buffer because it provides liquidity without forcing sales at depressed prices. That said, dividend income is not guaranteed, and “income safety” still depends on dividend durability. The objective is not to replace withdrawals completely, but to reduce pressure on the portfolio during stress periods.
This is where Above the Green Line concepts connect naturally to dividend handling. When the portfolio is designed around durable payers, verified coverage, and trend discipline, dividend income becomes more dependable as a planning tool. Without those safeguards, income distribution can create false confidence—investors may keep taking dividends from weakening businesses right up until the cut.
A practical policy statement: keep it simple, make it explicit
A master guide should encourage investors to write down a dividend policy in plain language. It doesn’t need to be complicated. It needs to be clear enough that the investor can follow it during volatility. Here is an example framework you can adapt:
- During accumulation years, dividends are reinvested automatically or redeployed monthly into the strongest watchlist candidates.
- During the transition period, a percentage of dividends is directed to cash reserves to build a 12–24 month runway.
- During income years, dividends fund lifestyle withdrawals first; supplemental withdrawals are drawn from cash reserves or planned sales when markets are favorable.
You can implement the same idea with different numbers. The important part is that the policy reduces improvisation. When the market drops, your decision is already made. That is what prevents “behavioral leakage”—the quiet underperformance caused by emotional decision-making at exactly the wrong time.
Choosing the right approach for your goals
If you are still building wealth and do not need the cash flow, reinvestment is usually the more powerful choice because it increases future income capacity and enhances long-term total return potential. If you are near or in retirement and need stable cash flow, income distribution can be the more appropriate choice because it supports lifestyle needs and can reduce forced selling. Many investors find the hybrid approach most realistic: reinvest during strong accumulation years, transition gradually, and use dividends as income when the need becomes real.
In the end, the reinvestment versus income decision is not a debate—it is a design choice. The most successful dividend investors treat dividend handling as part of the overall portfolio system: they know what they are trying to accomplish, they define a simple policy, and they execute it consistently so the portfolio supports both long-term compounding and real-world financial stability.
Numerical Illustration: Reinvestment vs. Income
Consider two investors, each starting with a $200,000 dividend portfolio yielding 3% annually with dividends growing at 6% per year.
Investor A – Reinvests Dividends
All dividends are reinvested for 15 years.
Investor B – Takes Dividends as Income
All dividends are withdrawn as cash for 15 years.
Year 1 Income (Both):
$200,000 × 3% = $6,000
After 15 years:
- Investor A (Reinvestment):
Share count has increased steadily, and the dividend per share has grown.
Annual dividend income ≈ $14,000–$16,000 depending on reinvestment timing. - Investor B (Income):
Share count remains constant; dividend per share still grows.
Annual dividend income ≈ $11,000–$12,000
Key Insight:
Both investors owned the same companies and experienced identical dividend growth rates. The difference was not stock selection — it was dividend handling. Reinvestment amplified future income capacity, while distribution provided earlier liquidity.
This example does not imply one method is superior. It illustrates that reinvestment favors future income expansion, while distribution favors present cash flow.
Key Takeaway
Dividend strategy should align with life stage and financial objectives.
Reinvestment builds future income power. Income distribution funds present needs.
The most effective approach is intentional — define when you are accumulating, when you are transitioning, and when you are living on the income, then execute that plan consistently rather than reacting to market emotion.
Behavioral Discipline and Emotional Control
Financial metrics and portfolio design form the analytical backbone of dividend growth investing, but behavioral discipline provides the psychological foundation. Markets are influenced by sentiment as much as fundamentals, and investors who fail to manage emotional responses often undermine otherwise sound strategies.
Periods of market decline often trigger anxiety, prompting investors to question stability even when fundamentals remain intact. Structured review methods counteract impulsive reactions and maintain continuity. Overconfidence presents the opposite risk, where extended success can breed complacency and neglect.
Dividend income offers a psychological advantage: predictable payments reduce emotional volatility and reinforce long-term focus. Discipline transforms dividend growth investing from theory into sustainable practice. Financial strength and diversification provide structural stability, but emotional control ensures continuity.
Market Drawdown Response Protocol
One of the most effective safeguards in dividend growth investing is not a financial metric but a behavioral rule: slowing down decision-making when markets are falling. Emotional reactions during drawdowns often lead to premature selling of otherwise durable companies or impulsive buying of perceived “bargains” that lack structural support. A predefined response protocol transforms volatility from a threat into a review process rather than a reaction.
When portfolio values decline or a holding experiences a sharp pullback, investors can apply a simple four-step checklist before taking any action:
- Review dividend safety metrics — Confirm payout ratios, free cash flow coverage, and recent earnings trends. If fundamentals remain intact, the income engine is likely still functioning even if price fluctuates.
• Review trend state — Determine whether the stock is still Above the Green Line, testing it, or structurally below it. This distinguishes temporary volatility from potential deterioration.
• Compare to watchlist alternatives — Ask whether capital is still positioned in one of the strongest available opportunities or whether a clearly superior candidate exists.
• Do nothing for 72 hours unless a rule is triggered — This pause interrupts impulsive decisions and ensures that any action aligns with predefined exit or reallocation criteria rather than emotional discomfort.
This protocol does not eliminate risk; it eliminates improvisation. The objective is not inactivity but intentionality. By introducing a brief decision buffer and a repeatable review sequence, investors maintain continuity during market stress and preserve the structural advantages of dividend growth investing. Over long horizons, disciplined behavior often contributes as much to portfolio success as financial analysis itself.
Economic Cycles and Dividend Durability
Dividend growth investing does not operate in isolation from economic reality; it functions within the recurring rhythm of expansion, contraction, and recovery that defines market cycles. Understanding how dividends behave during these phases allows investors to maintain perspective rather than reacting emotionally to temporary disruptions. Dividend durability is not measured solely during prosperous markets, but by a company’s ability to sustain and grow its payouts when economic conditions become less favorable.
During economic expansions, earnings growth, rising consumer demand, and favorable credit conditions often allow companies to increase dividends at an accelerated pace. This phase can create optimism and, at times, overconfidence. Dividend investors may be tempted to loosen evaluation standards or over-allocate to recently strong performers. A structured framework helps counterbalance this tendency by reminding investors that accelerated growth is cyclical rather than permanent. The objective during expansion periods is not to chase momentum indiscriminately, but to confirm that dividend increases are supported by durable earnings and healthy free cash flow rather than temporary surges in profitability.
Economic slowdowns and recessions serve as the true stress test for dividend strategies. Companies with conservative payout ratios, manageable debt levels, and consistent cash generation often maintain or only modestly slow dividend growth even as broader markets contract. These firms typically possess resilient business models—recurring revenue streams, essential products or services, and disciplined capital allocation policies—that allow them to navigate declining demand without sacrificing shareholder returns. Conversely, companies that relied heavily on leverage, cyclical revenue spikes, or aggressive distribution policies may be forced to freeze or reduce dividends, revealing vulnerabilities that were obscured during stronger conditions.
Inflationary environments introduce a different form of pressure. Rising input costs, wage growth, and higher interest rates can compress margins and increase financing expenses. However, businesses with pricing power—those able to pass cost increases to consumers without significantly reducing demand—often continue to grow dividends despite inflationary headwinds. In this context, dividend growth becomes more than an income stream; it becomes a mechanism for preserving purchasing power. Investors who emphasize companies with adaptable revenue models and strong competitive positioning are better equipped to maintain real (inflation-adjusted) income over extended periods.
Interest-rate cycles also influence dividend durability, particularly in capital-intensive industries. Higher rates can increase borrowing costs and shift investor preference toward fixed-income assets, temporarily reducing equity valuations. Dividend growth investors who focus on balance-sheet strength and interest-coverage capacity gain an advantage here, as companies with prudent debt structures are less likely to compromise dividends when financing conditions tighten. Rate-sensitive sectors such as utilities, real estate investment trusts, and infrastructure require especially careful evaluation during these phases, reinforcing the importance of sector-specific analysis within a diversified portfolio.
Another critical dimension of cycle awareness is behavioral resilience. Market downturns often produce disproportionate fear relative to underlying fundamentals, leading investors to exit positions prematurely. Dividend growth investing provides a stabilizing psychological benefit because regular income payments offer tangible evidence of ongoing corporate health even when share prices fluctuate. When supported by financial strength and diversification, this income continuity can reduce emotional volatility and encourage adherence to long-term plans rather than reactive decision-making.
Cycle-aware investors also recognize the opportunity embedded within volatility. Periods of market stress frequently produce valuation compression among fundamentally sound dividend-growing companies. Structured screening and disciplined entry criteria allow investors to selectively add high-quality holdings at improved yield levels without abandoning sustainability standards. In this sense, economic contractions are not merely risks to be endured but phases to be navigated with measured selectivity and analytical clarity.
Ultimately, economic cycles are inevitable, but their impact on dividend portfolios is not uniform. Companies grounded in strong balance sheets, consistent earnings, adaptable business models, and prudent payout policies tend to demonstrate dividend durability across varying conditions. Investors who accept cycles as recurring features rather than unpredictable anomalies shift their mindset from prediction to preparation. The advantage does not lie in forecasting the next recession or expansion, but in constructing portfolios capable of enduring both.
Dividend growth investing thrives precisely because it is designed for continuity rather than short-term performance. By integrating financial strength analysis, diversification, and disciplined review processes, investors position themselves to benefit from recoveries while minimizing the damage of contractions. Over extended horizons, this structural resilience transforms economic cycles from disruptive events into manageable phases within a broader compounding journey.
Integrating Dividend Growth With Broader Strategies and Common Misconceptions
Dividend growth investing does not need to exist in isolation. In practice, many successful portfolios combine dividend-producing assets with exchange-traded funds, technical momentum strategies, and selective growth positions. The objective is not to dilute the dividend philosophy, but to create a portfolio ecosystem where income stability and capital appreciation reinforce each other rather than compete. Dividend growth provides the structural foundation, while complementary strategies introduce flexibility and opportunity capture during different market phases.
One practical implementation is the Dividend Core + Tactical Satellite model. In this structure, the majority of capital is allocated to durable dividend-growing companies that serve as the income and stability engine of the portfolio. A common framework might allocate approximately 60% to a dividend core, with the remaining 40% directed toward tactical or growth-oriented strategies such as momentum trades, sector ETFs, or selective swing-trading opportunities. The exact percentages are not rigid; they are guidelines that allow investors to balance reliability with adaptability.
The dividend core acts as the portfolio’s anchor. These holdings are typically companies with strong balance sheets, predictable cash flow, and consistent dividend growth histories. Their purpose is not rapid acceleration but continuity — they generate income, reduce volatility, and provide psychological stability during market downturns. Because these assets are often held for extended periods, they also benefit most from compounding and reinvestment discipline.
The tactical satellite, by contrast, serves as the portfolio’s opportunity engine. This portion may include growth stocks, sector rotations, thematic ETFs, or structured swing-trading positions aligned with technical momentum. The satellite allocation is inherently more dynamic, allowing investors to respond to emerging trends without disturbing the income foundation of the portfolio. Importantly, this segment operates within predefined risk parameters so that tactical experimentation does not jeopardize long-term capital integrity.
Within the Above the Green Line philosophy, this blended model aligns naturally with rules-based investing. The dividend core emphasizes financial durability and trend confirmation, while the satellite allocation applies technical timing and momentum discipline. Rather than forcing investors to choose between income and growth, the system recognizes that different strategies can coexist when governed by structure. This integration is particularly effective for investors transitioning from pure swing trading into longer-term wealth building, as it preserves familiarity with technical frameworks while introducing the stabilizing benefits of dividend compounding.
Common misconceptions often arise when strategies are viewed as mutually exclusive. Some investors believe dividend portfolios lack growth potential, while others assume tactical strategies are incompatible with income investing. In reality, the combination can be complementary. Dividend growth investing provides resilience and predictability, while tactical allocations introduce controlled adaptability. When executed within a rules-based structure, the portfolio becomes both durable and responsive — capable of sustaining income while still participating in periods of accelerated market opportunity.
Ultimately, integration is not about complexity; it is about intentional design. A portfolio that blends dividend stability with tactical flexibility reflects a mature investment framework — one that acknowledges that markets evolve, opportunities shift, and investor goals change over time. By defining clear allocation boundaries and maintaining disciplined evaluation criteria, investors create a system where dividend growth serves as the foundation and broader strategies act as calibrated extensions rather than distractions.
Key Takeaway and Final Framework
Dividend growth investing is not merely about collecting income; it is about building a self-expanding financial ecosystem grounded in sustainability, diversification, and disciplined evaluation. By combining financial strength analysis, portfolio balance, and structured decision-making principles, investors transform dividends into durable long-term wealth rather than temporary payouts.
The Dividend Growth Master Guide is not intended to be read once and forgotten. It is a living framework—an evolving reference that grows alongside financial knowledge and portfolio experience. Markets will fluctuate, industries will shift, and economic cycles will repeat, but the principles of disciplined dividend growth investing remain remarkably consistent.
At Above the Green Line, the objective is not to predict the market but to prepare for it. Wealth built through dividends is not sudden. It is deliberate, compounding, and resilient—qualities that mirror the mindset of the investor who chooses discipline over impulse and structure over speculation.
| Category | The “Buy” Signal | The “Hard Exit” Rule |
|---|---|---|
| Price Trend | Assets are trading Above the Green Line (long-term moving average) with positive momentum. | Price breaks and sustains a close Below the Green Line. |
| Dividend Safety | FCF Payout Ratio is within sector-specific healthy ranges. | Mandatory Sell: Any Dividend Cut or Elimination. |
| Cash Flow | Positive Free Cash Flow (FCF) that covers the dividend with a margin of safety. | Mandatory Sell: FCF Payout Ratio > 100% for two consecutive quarters. |
| Growth Vitals | Year-over-Year (YoY) Revenue and Earnings are stable or expanding. | Mandatory Sell: Sustained declining YoY Revenue/Earnings (The “Safety Cross”). |
| Sector Metrics | Evaluation using adjusted metrics (e.g., AFFO for REITs, DCF for Energy). | Failure to meet adjusted cash flow coverage thresholds. |
This final summary serves as your operational command center. It distills the entire ATGL framework into a single, binary decision matrix designed to remove hesitation from your process. Whether you are conducting a weekend scan or reacting to an earnings report, this table provides the definitive thresholds for capital allocation and preservation.