
By ATGL
Updated September 25, 2025
A dead cat bounce represents one of the most deceptive phenomena in financial markets, capable of misleading even experienced traders into believing a declining asset has reached its bottom. This temporary price recovery occurs amid sustained downtrends, creating false signals that can trap investors in deteriorating positions. Understanding this pattern proves vital for traders seeking to navigate bearish market conditions effectively.
What Is A Dead Cat Bounce?
A dead cat bounce describes a brief, temporary recovery in an asset’s price following a severe decline, which subsequently resumes its downward trajectory. The term originates from Wall Street folklore, referencing the notion that “even a dead cat will bounce if it falls from a great height.”
The phenomenon occurs frequently in bearish markets where market sentiment remains predominantly negative. During these periods, oversold conditions trigger automatic buying from algorithmic trading patterns or bargain hunters seeking value opportunities. However, these purchasing spurts typically lack the volume and conviction necessary to sustain meaningful recoveries.
Dead cat bounces often coincide with significant market stress, when panic selling creates temporary supply-demand imbalances. The subsequent bounce provides false hope, leading many to mistake temporary relief for genuine market stabilization.
How Does the Dead Cat Bounce Work?
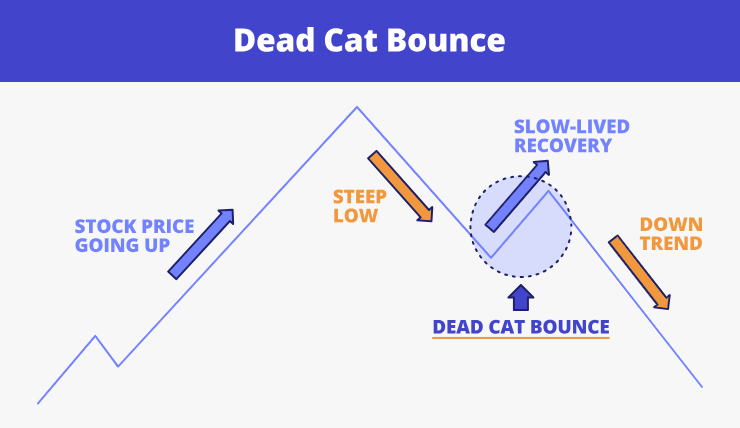
A dead cat bounce follows a predictable sequence: sharp price decline, brief recovery without fundamental improvement, followed by renewed selling pressure that often drives stock prices below previous lows. This pattern differs fundamentally from authentic reversals, which typically display stronger volume characteristics, broader market participation, and supportive economic fundamentals.
The mechanics involve temporary exhaustion of selling pressure rather than genuine buying interest. When prices fall rapidly, oversold readings trigger automated buying responses. However, this mechanical buying lacks the organic demand necessary to sustain upward momentum, resulting in renewed selling once the temporary imbalance corrects itself.
How To Identify A Dead Cat Bounce On A Chart
Identifying dead cat bounces requires analysis of multiple technical indicators and market context. Visual characteristics typically include a sharp initial decline of 10%-20% or more, followed by a recovery retracing approximately 30%-50% of the original fall before resuming the downward trajectory. These patterns often appear as brief spikes within broader declining channels or parabolic curves.
Volume analysis provides critical confirmation signals. Authentic recoveries typically display increasing volume as prices advance, indicating genuine buying interest. Conversely, dead cat bounces often occur during periods of decreasing or below-average volume, suggesting weak participation and a lack of conviction among market participants.
Retracement depth offers additional clues about bounce authenticity. Dead cat bounces typically retrace between 23.6% and 50% of the preceding decline using Fibonacci retracement levels. Stronger bounces exceeding 61.8% retracement levels may indicate more substantial recovery potential, though context remains paramount.
Historical Examples Of Dead Cat Bounces
The 2008 financial crisis provides numerous examples across major market indices. Following the collapse of Lehman Brothers, the S&P 500 experienced several significant bounces, exceeding 10%, before ultimately reaching its March 2009 lows. These rallies consistently failed at previous support levels, demonstrating classic dead cat bounce characteristics.
Individual stocks during the dot-com bubble collapse also exhibited pronounced patterns. Technology companies like Pets.com experienced dramatic bounces of 50% or more following initial declines, only to resume their descent toward eventual bankruptcy. The 2022 cryptocurrency market decline featured multiple rallies exceeding 20% in Bitcoin and Ethereum during their broader bear market, only to establish new lows subsequently.
Trading Strategies And Risk Management
Successful navigation of dead cat bounce environments requires disciplined risk management and strategic position sizing. Traders should reduce position sizes during suspected bounce periods and implement tight stop-loss orders to limit potential losses. Entry points during these patterns demand exceptional caution, with preference given to short positions rather than attempted bottom-picking strategies.
Support and resistance levels become paramount during analysis. Previous support areas that have been broken often serve as resistance during bounce attempts, providing logical exit points for long positions or entry points for short trades. Position sizing strategies should reflect the elevated risk environment, with reductions of 50% or more allowing participation while limiting exposure to false signals.
Confirmation signals before acting prove critical during suspected dead cat bounces. Waiting for multiple timeframe confirmations, volume validation, and momentum indicator alignment reduces the probability of entering positions based on false signals.
How To Avoid Common Mistakes
The most frequent error involves mistaking temporary relief for sustained recovery. Traders often interpret initial bounce signals as trend reversal confirmations, leading to premature long position establishment. This mistake proves particularly costly when the primary downtrend reasserts itself with renewed vigor.
Ignoring broader market conditions represents another critical oversight. Individual stock bounces within bear markets face significant headwinds from sector rotation, reduced risk appetite, and institutional selling pressure. Comprehensive market analysis helps traders understand the broader context affecting individual position prospects.
Investment decisions regarding dead cat bounce stock require careful fundamental analysis beyond technical pattern recognition. Overtrading during volatile downtrends amplifies losses and reduces overall portfolio performance. Understanding the distinction between bull and bear markets helps traders adjust their strategies appropriately.
Make Better Investment Decisions
Mastering dead cat bounce identification represents a crucial skill for traders operating in volatile markets. The ability to distinguish between temporary relief rallies and genuine recovery attempts can significantly impact portfolio performance during challenging conditions.
Professional traders often utilize additional patterns, such as the pipe bottom pattern and bear flag pattern, to complement their analysis. These complementary patterns provide additional context for understanding market structure and potential future price movements.
Above the Green Line offers comprehensive resources and professional guidance to help traders develop sophisticated analytical skills and risk management techniques. Take your trading to the next level with Above the Green Line’s professional membership services. Access exclusive market insights, advanced technical analysis, and personalized guidance from experienced professionals who understand the intricacies of modern financial markets.

Related Articles

Margin Call Explained: What Triggers It and How to Avoid One

AMC Short Squeeze Explained: Timeline, Causes, and Trading Risks

Volatility Clustering in Financial Markets: Understand Why It Happens

Chaikin Money Flow (CMF): How to Use Volume to Spot Real Market Strength
