By ATGL
Updated November 14, 2024
[atgl_footer
In today’s unpredictable financial landscape, understanding investment strategies has never been more crucial. The Capital Asset Pricing Model (CAPM) offers a framework for assessing the relationship between risk and expected returns, grounded in a set of foundational assumptions that guide investors in making informed decisions.
CAPM is widely recognized for its role in helping investors gauge the potential return on an asset while considering its inherent risk. By utilizing a straightforward formula, it simplifies the complexities of financial markets and enables both institutional and individual investors to allocate resources more efficiently.
This article will delve into the key assumptions underpinning CAPM, explore its practical applications, and illuminate how these concepts can enhance your investment strategies. By the end, you’ll have a clearer understanding of how to leverage CAPM for smarter investment decisions.
Definition and Purpose of CAPM Assumptions
The Capital Asset Pricing Model (CAPM) rests on several key assumptions aimed at simplifying the complexities of capital markets to facilitate the analysis of investment returns. Primarily, it assumes all investors strive to maximize their economic utilities without the interference of taxes or transaction costs. This creates a frictionless market environment where trading decisions are primarily influenced by potential returns and the levels of risk associated.
Investors in CAPM are presumed to maintain a diversified portfolio akin to the market portfolio, effectively neutralizing unsystematic risk. By doing so, they can focus on systematic risks that impact overall market trends. Rational investors, who are inherently risk-averse, seek to accumulate wealth while minimizing their exposure to risk—a principle central to the CAPM framework.
The model also assumes financial markets to be competitive and efficient, characterized by free and equal access to all relevant information that might affect asset pricing. This transparency ensures that securities are priced correctly at any given time based on available data.
Additionally, CAPM presumes that all assets can be divided infinitely, allowing investors to buy and sell them in any quantity desired. This assumption is significant because it facilitates the construction of diversified portfolios tailored to an investor’s risk tolerance and financial goals.
How CAPM Works
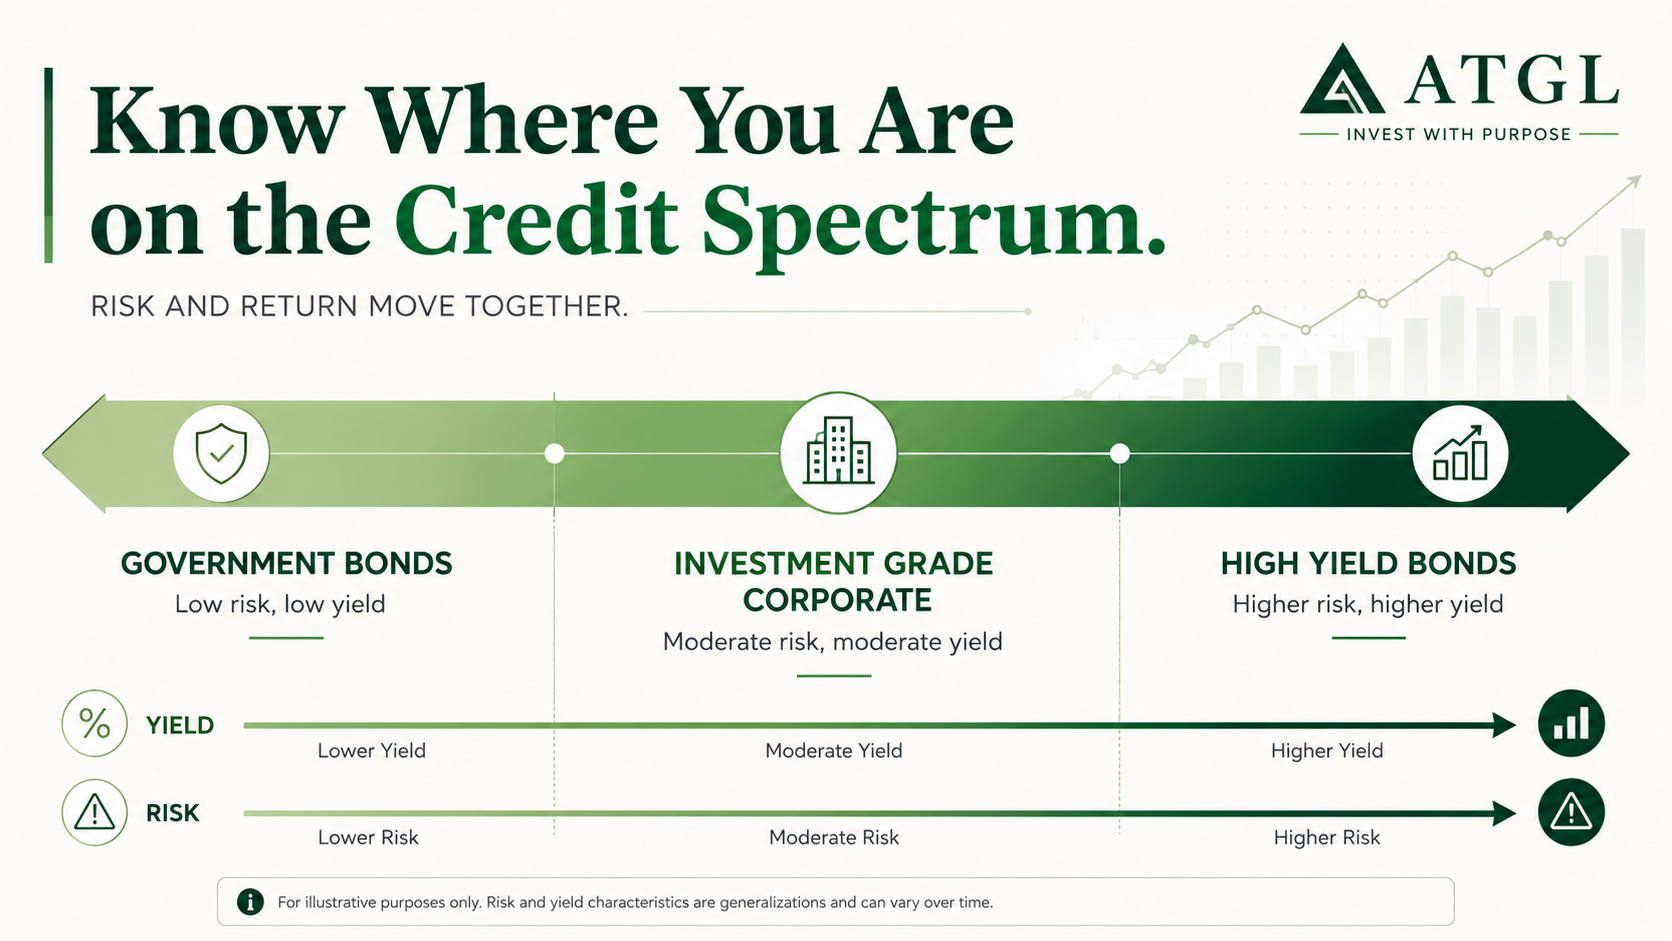
CAPM is a pivotal model in finance used to determine the expected return on an asset by linking it to its risk, derived through the asset’s beta coefficient. The model incorporates the risk-free rate, typically the return on government bonds, and the equity risk premium, which represents the average market return above the risk-free rate.
The CAPM formula, expressed as E(r_i) = R_f + β_i(E(r_m) – R_f), serves as a benchmark to estimate the required rate of return for a given financial asset i. Here, E(r_i) stands for the anticipated return on the asset, R_f is the risk-free rate, β_i is the asset’s beta reflecting its sensitivity to market movements, and E(r_m) is the average return on the capital market.
The significance of CAPM lies in its capacity to attribute asset returns primarily to systematic risks rather than idiosyncratic, asset-specific risks. This focus allows investors to assess the risk-reward profile of investments in the context of broader market performance.
CAPM’s structure also permits stress-testing, offering a range of possible returns that help investors gauge the reliability of their expected returns. By understanding these probable outcomes, investors can make more informed decisions on portfolio construction and management, enhancing their confidence in achieving desired financial objectives.
Formula and Calculation
The CAPM formula is succinctly captured as:
[ E(R_i) = R_f + \beta_i \times (E(R_m) – R_f) ]
Where:
- ( E(R_i) ) denotes the expected return on asset i.
- ( R_f ) is the risk-free rate, often the yield on a 10-year US government bond.
- ( \beta_i ) measures the asset’s sensitivity or risk relative to market fluctuations.
- ( E(R_m) ) is the average return on the capital market.
To compute the expected return on an asset, one must understand that Beta quantifies the asset’s systematic risk. The formula allows investors to calculate returns by considering market conditions and risks involved.
Expected Return on an Asset
In CAPM, expected returns are a forecast of investment performance over its holding period. Using the CAPM formula, this projection links an asset’s future returns to its systematic risk, as measured by beta. The risk-free rate acts as a baseline, with the risk premium offering insight into the additional return sought for taking on market risk. This framework helps investors ensure that their investments are aligned with their risk appetites and long-term goals.
Key Assumptions of CAPM
The Capital Asset Pricing Model (CAPM) is grounded in several critical assumptions that guide its framework. Central to these is the notion that investors are rational and risk-averse, prioritizing the maximization of expected returns while minimizing risk. Additionally, CAPM presumes that investors share identical investment horizons, thereby influencing risk and return decisions uniformly. A crucial assumption is that there are no taxes or transaction costs, allowing for a cleaner evaluation of security pricing and anticipated returns. Financial information is presumed to be freely and instantaneously accessible to all investors, leading to fair market pricing of securities. Moreover, all assets are assumed to be infinitely divisible, which grants investors flexibility in purchasing or selling assets in any quantity without constraint.
Efficient Markets
CAPM assumes financial markets are efficient, characterized by competitive conditions where investors have costless access to market information. Prices promptly adapt to new public information, making it difficult to spot and exploit inconsistencies. The efficient market hypothesis (EMH) asserts that security prices fully reflect all available information. Under this blanket of efficiency, there are supposedly no transaction costs, taxes, or restrictions on short selling, which allows for smooth trade and price adjustments. This assumption implies that investors hold homogeneous perceptions regarding the market portfolio, aligning with the foundational principles of CAPM.
Risk-Free Rate
The risk-free rate plays a fundamental role in CAPM. It represents the return on an investment devoid of risk, typically approximated by government bond yields. This rate is crucial for calculating expected returns on investments, as it is combined with the equity risk premium and an asset’s beta in CAPM’s formula. A higher risk-free rate generally raises the cost of equity, influencing decisions related to riskier projects. For corporations, understanding the current risk-free rate is vital in evaluating the viability of new ventures and balancing potential returns against inherent risks.
Beta and Systematic Risk
In CAPM, beta quantifies systematic risk, defining how a security’s returns correlate with broader market movements. A beta of 1.00 suggests the security’s price mirrors market fluctuations, reflecting an average level of systematic risk. Securities with beta values above 1.00 are more sensitive, bearing higher systematic risk, while those below 1.00 exhibit less volatility compared to the market. This coefficient is pivotal in risk-return analysis, as it highlights the level of systematic risk attached to an asset. Investment decisions are significantly swayed by beta, as it helps gauge the potential risk and return of securities within a portfolio.
Investor Rationality
CAPM predicates on the rationality of investors, implying they thoroughly evaluate available information to make informed investment choices. Investors are expected to be risk-averse, demonstrating varying degrees of aversion to risk while maintaining a focus on maximizing returns. Although CAPM models assume rational behavior, psychological biases can sometimes result in irrational decisions. However, such deviations are typically not significant enough to disrupt the model’s outcomes. The model assumes all investors access the same information and reach consensus on the risk and expected return for assets, though this often proves impractical in real-world dynamics.
Single Period Investment Horizon
A key simplification in CAPM is the single-period investment horizon, standardizing the timeframe for comparing investment opportunities. This assumption eases decision-making processes by providing a uniform evaluation period, allowing coherent analysis across varied investment options. Nonetheless, this presumption often clashes with the multi-period nature intrinsic to real-world investment appraisals, where variables frequently shift over time. Practitioners may treat CAPM variables as consistent over consecutive periods, yet this view may not align with actual experiences. Consequently, relying solely on a single-period framework can result in potential inaccuracies due to the complex and evolving nature of investment returns across time.
This concise outline of the key assumptions underpinning CAPM provides a clear understanding of its foundational principles and practical implications for investors and corporations in the realm of corporate finance.
Applications of CAPM
The Capital Asset Pricing Model (CAPM) serves multiple key roles in finance. Regulators, such as the Florida Public Service Commission, use CAPM to calculate the cost of capital for shareholder-owned utility companies, like water and wastewater utilities. This model is also pivotal in measuring and appraising the performance of investment portfolios and their managers, as it establishes a performance benchmark.
CAPM provides essential guidance for investors regarding asset allocation and investment planning. By helping determine the expected returns based on associated risks, investors can make informed decisions. In corporate finance, CAPM aids in capital budgeting by calculating the hurdle rate for projects, reflecting the project’s specific risk. This information empowers more strategic investment planning.
Furthermore, CAPM can estimate the expected return on a portfolio by considering the portfolio’s beta. This beta is a weighted average of the individual securities’ betas, thereby contributing to more tailored investment strategies. Through these applications, CAPM enhances decision-making processes across various financial contexts.
Let Above the Green Line Help With Your Investments
Let Above the Green Line assist you in navigating the complexities of investment decisions using the Capital Asset Pricing Model (CAPM). With a focus on expected returns and systematic risk, CAPM provides a clear framework for understanding how investments perform within the capital markets. Above the Green Line simplifies these concepts, helping you ensure your portfolio aligns with your risk tolerance and investment goals along with providing insightful information like dividend calendar.
Our service clarifies the CAPM assumptions, such as homogeneous expectations and the ideal risk-free rate, helping you make informed choices. By analyzing systematic risk and the cost of equity, we enable you to balance risk and potential returns effectively.
Rational investors looking to compare various investment opportunities will benefit from our streamlined analysis process, guided by the CAPM’s insights. Trust Above the Green Line for a strategic approach in building diversified portfolios aligned with the market’s dynamics and your personal financial aspirations.
_banner]
Related Articles

What Is a Good Return on Investment? Benchmarks by Asset Class

How to Use Net Present Value (NPV) for Dividend Stocks

Free Cash Flow: The Ultimate Guide to Financial Strength and Dividend Sustainability

Dividend Reinvestment Plan (DRIP): How Automatic Reinvestment Builds Long-Term Wealth