By ATGL
Updated August 22, 2025
Chart patterns are essential tools for investors and traders who rely on technical analysis. By studying recurring formations and combining them with technical indicators, you can anticipate market reversals and refine your timing for both entries and exits.
One lesser-known yet highly effective reversal setup is the bump and run pattern. This formation helps identify exhaustion in prevailing trends and provides traders with actionable signals for potential reversals. It’s especially useful when you want an objective method to recognize when price action becomes unsustainable.
In this guide, you’ll learn how the bump and run reversal pattern works, its defining characteristics, and how to apply it in live market conditions.
What Is the Bump and Run Pattern in Trading?
The bump and run reversal pattern is a price chart formation that signals a sharp price move against a gradual lead-in trend, followed by a corrective breakdown. Originally introduced by Thomas Bulkowski, this setup illustrates how excessive speculation pushes prices too far, too quickly, before a trend reversal occurs. Traders often use it in conjunction with moving averages or oscillators to validate the setup and confirm that momentum has shifted.
In trading terms, a bump and run develops in three stages:
- A steady price climb or decline (the lead-in).
- A sudden and unsustainable surge (the actual bump).
- A breakdown that retraces the exaggerated move (the run).
Recognizing this sequence enables you to anticipate turning points before broader market participants react. Compared with other reversal setups, such as the double top pattern or the island reversal pattern, the bump and run is unique because it relies on slope steepness and volume behavior.
Key Features of the Bump and Run Chart Pattern
Several characteristics distinguish this bump pattern from other trading formations:
- Slope of the trendline: The initial trend (lead-in) usually rises or falls at a sustainable angle of 30 to 45 degrees. Once the bump begins, the slope steepens to 50 to 60 degrees or more, reflecting overextension. This stage often introduces a bump trend line that traders monitor closely.
- Volume dynamics: Volume tends to be moderate during the lead-in phase, spikes during the bump, and contracts again before the run develops. Monitoring this behavior alongside momentum oscillators can help validate whether the shift is reliable.
- Trendline interaction: Prices consistently respect the trendline during the lead-in but break below (or above, in bearish setups) once the run phase begins.
By tracking these elements, especially slope changes, you can distinguish between a healthy trend and one at risk of reversing.
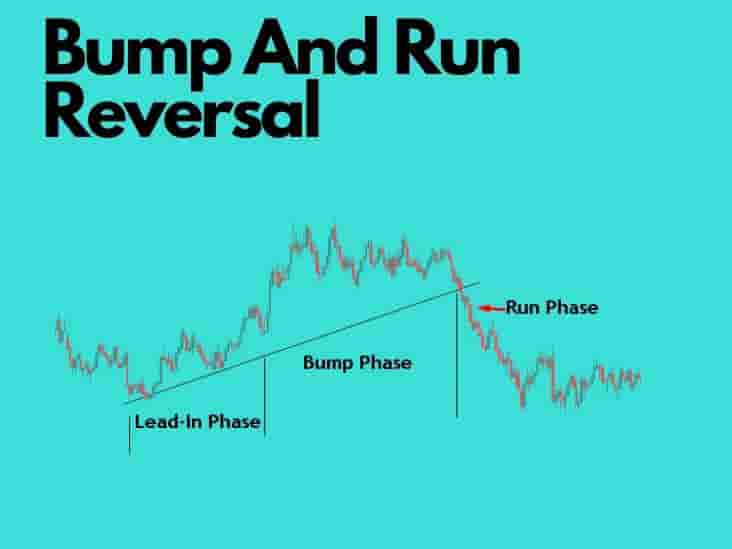
Breaking Down the 3 Phases of the Bump and Run Reversal Pattern
Each stage of the bump and run pattern carries different technical implications, making it useful to examine them step by step.
- The Lead-In Phase
The setup begins with a steady uptrend or downtrend. The slope here is sustainable, usually between 30 and 45 degrees, with consistent but not excessive volume. This stage reflects orderly market participation. Note that without this gradual foundation, a subsequent bump and run formation is less reliable.
- The Bump Phase
The second stage features a sharp, accelerated price move. Here, the slope often exceeds 50 degrees, and volume surges as speculation intensifies. This steep rally or selloff represents overextension. While it may be tempting to follow the momentum, disciplined traders recognize this as a warning sign that the market could reverse once it approaches key resistance levels or fails to hold critical support levels. These areas act as confirmation points that can either reinforce or invalidate the expected move.
- The Run Phase
The run begins once the price breaks the established trendline. In bullish scenarios, this means a sharp decline below the lead-in line, while in bearish cases, prices surge above it. This breakdown often comes with renewed volume. The run provides the most actionable opportunity, as it signals a new directional move supported by strong momentum. Waiting for confirmation on higher timeframes can further reduce risk.
Bump and Run Trading Pattern Strategies You Can Apply Today
To use the bump and run reversal effectively, focus on execution rules that protect against false signals.
- Entry points: Wait for a confirmed break of the trendline during the run phase. Premature entries during the bump phase carry a higher risk.
- Stop losses: A common method is to place stops just beyond the high of the bump in bearish setups or below the low of the bump in bullish reversals. This limits exposure if the market resumes the prior trend.
- Profit targets: Many traders measure the distance of the bump from the trendline and project that move downward (for bearish setups) or upward (for bullish ones) to estimate price objectives.
Bullish vs. Bearish Bump and Run Setups
The pattern applies in both directions:
- Bullish reversal: Forms when a downtrend steepens into an unsustainable selloff. Once the breakdown halts and price reclaims the trendline, traders can target long entries during the run.
- Bearish reversal: More common, this occurs after a gradual uptrend turns parabolic. Once the price breaks the supporting trendline, traders can initiate short positions to capture the downside move.
By applying strict rules for confirmation and risk management, you can take advantage of both bullish and bearish variations with discipline.
How It Differs From Other Reversal Patterns
Although the bump and run is part of the broader family of reversal setups, it has unique traits. Unlike the symmetrical formation of the double bottom pattern, the bump and run emphasizes slope steepness and accelerated price action. Compared to the head and shoulders or the island reversal, this formation is less about repeated tests of support or resistance and more about identifying unsustainable market momentum. These differences make it particularly valuable when you want to act earlier rather than waiting for multiple confirmations.
Trade the Market With Confidence Using Pattern-Based Insights
The bump and run pattern gives you a structured way to identify when a trend has become overextended and prepare for a reversal. By breaking down the formation into its lead-in, bump, and run phases, and applying rule-based strategies for entries, stop placement, and profit-taking, you can trade this setup with confidence.
Pattern recognition remains one of the most powerful tools in technical analysis. Whether you are focusing on the bump and run, trading patterns, or other reversal signals, consistency in execution is key. Traders who combine these setups with disciplined risk management often achieve more consistent performance over time.
If you’re ready to strengthen your approach and gain access to systematic insights on technical setups, explore Above the Green Line memberships to trade the market with greater confidence.

Related Articles

International Shipping Index: What It Reveals About Global Trade Trends

Understanding Market Microstructure for Better Trading Decisions

Understanding the Liquidity Trap and Its Impact on Investors
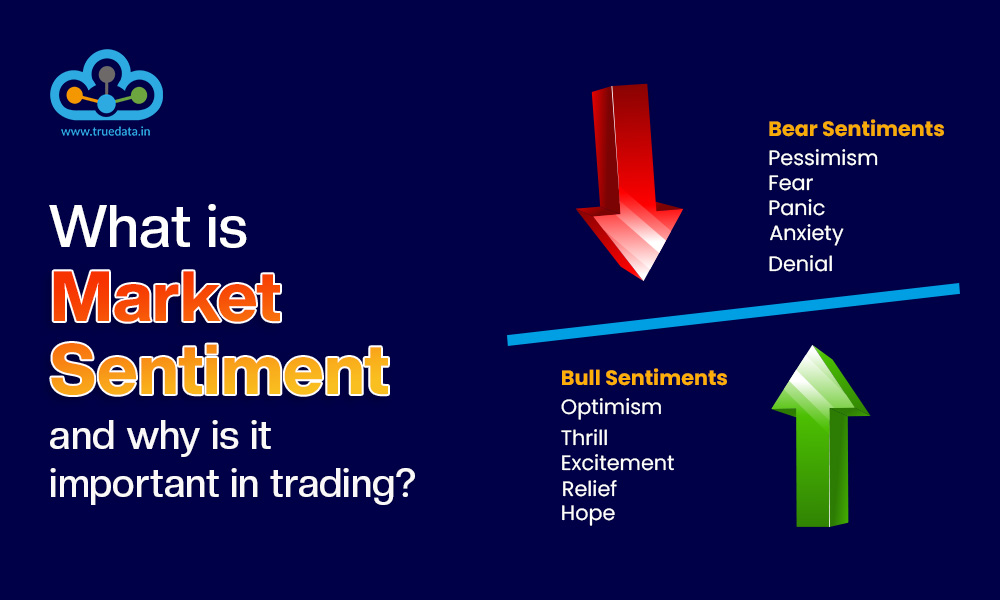
How Market Sentiment Indicators Can Influence Trading Decisions