
By ATGL
Updated July 6, 2025
The broadening top chart pattern is one of the most distinctive reversal formations in technical analysis. This pattern emerges when stock prices create a series of higher highs symmetrical triangle patterns that narrow over time, broadening tops widen as they develop, creating a unique visual signature that signals potential trend reversal and significant market shifts.
This formation typically appears after extended uptrends, marking periods where market participants demonstrate increasing disagreement about fair value. The pattern’s expanding nature reflects growing uncertainty as buyers push prices to new peaks while sellers drive them to deeper troughs.
Spotting a Broadening Top Pattern in Real Time
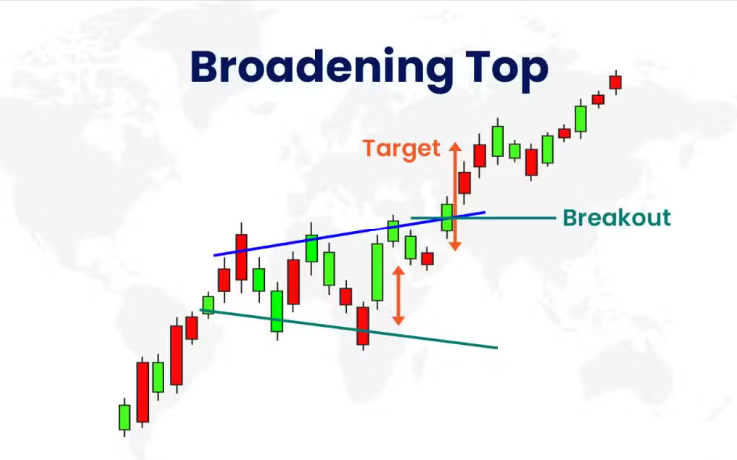
A broadening top pattern develops through a specific sequence of price movements that create its characteristic expanding structure. The formation begins with an initial peak, followed by a significant decline to establish the first trough. Subsequently, prices rally to create a higher high, then decline to form a lower low. This process continues, with each successive peak reaching higher levels and each trough dropping to lower points.
The pattern requires at least five pivot points—three peaks and two troughs—to establish validity. The upper trendline connects the ascending peaks, while the lower trendline links the descending troughs, forming the broadening top formation’s distinctive boundaries.
Visual Cues of a Broadening Top Formation
Recognizing a broadening top chart pattern on price charts requires attention to specific visual elements. The most obvious characteristic involves the expanding price range, where the distance between highs and lows increases over time, creating the pattern’s signature megaphone appearance.
Volume behavior provides another critical visual cue, often increasing on both upward and downward price movements. This reflects the intensifying battle between bulls and bears as high volatility becomes the pattern’s defining characteristic. The formation indicates growing market uncertainty as participants disagree about appropriate price levels.
Why the Broadening Top Signals Market Uncertainty
The broadening top formation signals escalating market uncertainty through its expanding volatility profile. As prices create higher highs and lower lows, the pattern reflects fundamental disagreement among market participants about asset valuation and future direction.
Market psychology during development reveals competing forces at work. Buyers become increasingly aggressive in pushing prices to new highs, while sellers respond with equal force to drive prices lower. This creates the expanding price envelope that characterizes the pattern.
Broadening top formations are predominantly bearish patterns. While the pattern creates higher highs during development, the overall structure suggests distribution and eventual downside resolution. The expanding price volatility indicates a loss of upward momentum and growing selling pressure.
Price Action and Volume: Keys to Confirmation
Volume analysis plays a crucial role in validating broadening top patterns and avoiding false signals. Authentic patterns typically display increasing volume during both rallies and declines within the formation, reflecting genuine market disagreement.
Traders should monitor volume behavior at key pattern points. Volume spikes during moves to new highs or lows confirm the pattern’s validity, while diminishing volume suggests potential breakouts may be false signals. The most significant volume confirmation occurs during pattern resolution, when price breaks occur below the lower trendline with above-average trading activity.
Price action confirmation involves observing how the asset behaves at the pattern’s boundaries. Valid patterns show respect for the diverging trendlines, with prices rebounding from the upper line during rallies and finding support at the lower line during declines.
Broadening Top Chart Pattern Trading Strategy
Trading broadening tops requires systematic approaches that combine pattern recognition with risk management principles. The most conservative strategy involves waiting for pattern completion before entering positions, reducing false signal risk.
Entry strategies should focus on the pattern’s resolution phase. Traders typically enter short positions when prices break below the lower trendline with confirming volume. This breakout represents pattern completion and signals the beginning of the anticipated downward move.
Target setting utilizes the pattern’s height measurement. Measure the distance between the highest high and lowest low within the formation, then project this distance downward from the breakdown point. This technique provides objective price targets based on the pattern’s volatility range. Successful implementation requires integrating this approach with different investment strategies for optimal results.
Entry and Exit Rules Based on Price Action
Effective entry rules combine multiple confirmation signals. Enter short positions only after prices close below the lower trendline with volume expansion exceeding recent averages. This combination reduces false signal probability and increases trade success rates.
Exit strategies should account for both profit-taking and loss limitation scenarios. Primary profit targets derive from pattern height measurements, while stop-loss placement above the pattern’s most recent high provides clear invalidation criteria.
Best Time Frames and Market Conditions To Trade the Pattern
Broadening top chart patterns perform most effectively on longer time frames, where patterns have sufficient time to develop properly. Daily and weekly charts typically provide the most reliable signals, as shorter time frames may generate false patterns lacking necessary underlying market dynamics.
Swing traders find these approaches work particularly well with broadening tops, as pattern development and resolution often span several weeks or months. The extended time frame allows traders to identify formations early and position themselves for eventual breakdowns. Market conditions significantly impact pattern reliability, with formations typically performing best during transitional periods when major trends change direction.
Common Mistakes When Trading Broadening Tops
Premature entry represents one of the most frequent errors when trading broadening top patterns. Many traders attempt to short the pattern before completion, hoping to capture the entire move from the upper boundary. This approach often results in losses as prices may continue reaching new highs within the expanding formation.
Another common mistake involves ignoring volume confirmation. Patterns developing without increasing volume often fail to produce expected price moves. Position sizing errors also plague traders, as market volatility within the pattern requires appropriate risk management to protect capital during uncertain conditions.
How To Avoid False Signals: Smart Tips
Avoiding false signals requires multiple confirmation techniques working together.
First, verify that the pattern contains at least five pivot points with clear expanding boundaries. Patterns with fewer turning points lack the development necessary for reliable signals.
Second, examine the broader market context. Broadening tops work best when they align with overall market weakness or sector rotation.
Third, use technical indicators for trading to provide additional confirmation. Momentum oscillators showing negative divergence during pattern development strengthen the bearish case. Consider integrating these formations with other popular patterns in trading for comprehensive market analysis.
Turn Volatility Into Opportunity With Smart Pattern Recognition
Ready to enhance your pattern recognition skills and develop comprehensive trading strategies? With an Above the Green Line membership, you can explore advanced chart analysis techniques and systematic approaches to market analysis through our comprehensive trading education resources. Master the art of identifying high-probability trading opportunities across various market conditions and time frames.

Related Articles

Penny Stocks: How to Identify High-Probability Setups Using Rules-Based Investing

Margin Call Explained: What Triggers It and How to Avoid One

AMC Short Squeeze Explained: Timeline, Causes, and Trading Risks

Volatility Clustering in Financial Markets: Understand Why It Happens
