
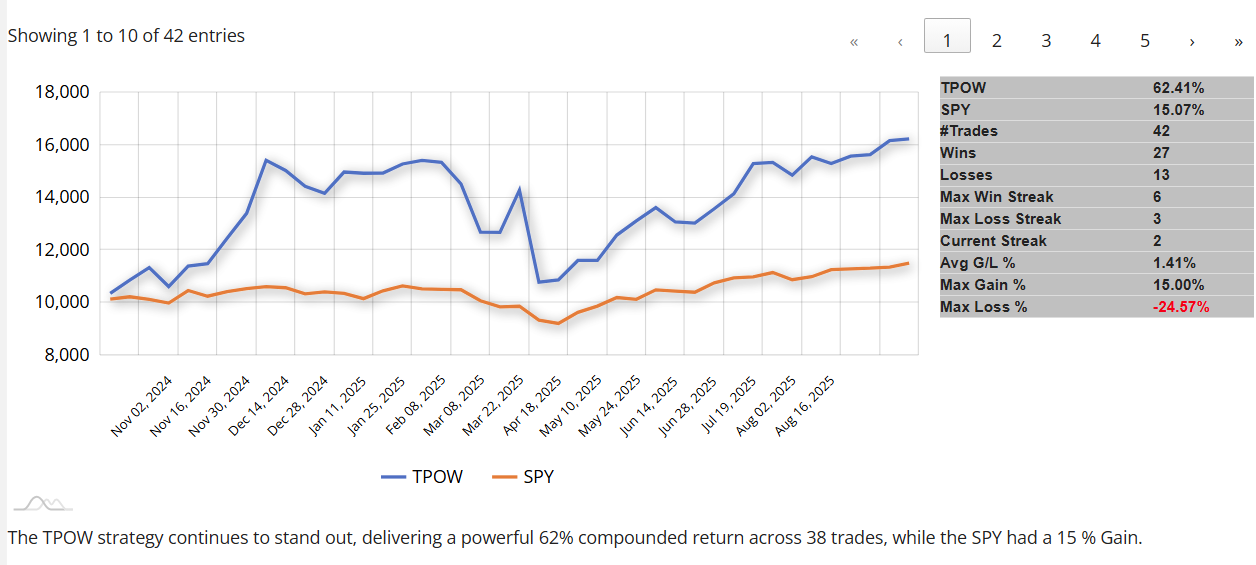
The Top Pick of the Week System is up +62 % compounded, vs the S&P 500 up +15% (since the Oct. 7, 2024 inception).
For busy investors that don’t have time to Swing Trade, we now have a simple Strategy:
Top Pick of the Week. You Buy the “Pick” on Monday morning, and then Sell on Friday’s Close. It’s a time-efficient approach designed to capture short-term gains without requiring constant market monitoring.
This “Pick” is emailed to you with this Weekly Commentary (see below & more details here).
The Top Pick of the Week is: Archer Aviation Inc. $ACHR to be bought on the Open on Monday, and will be sold on the Close on Friday.
You can view the current Weekly Stock Performance.
______________________________________________________________________________
DAILY SWING TRADING (SHORT TERM)Watch List and Charts to Buy Soon.
| Daily Swing Watch List to Buy | Daily Swing Charts to Buy |
| Current Daily Swing Positions | Current Swing Charts |
| Closed Daily Swing Results | Trading Dashboard |
9/14/2025 Markets were up for the week as some of the Big Tech surged higher on Earnings. The S&P 500, DOW 30, & NASDAQ 100 Indices were able to make higher highs again with limited selling.
Investors are betting that the FED will Cut short term Interest Rates on Wednesday, and have been panic Buying on FOMO (Fear of Missing Out). But there is a Cost to Cutting Rates, as cutting adds liquidity to the Economy and would normally increase Inflation.
The Strongest Stocks and Indices are very overbought now after the April Fear Flush down. Smart Money has been Raising Cash to be able to Buy these Leaders on the next pull-back. Gold Miners made new highs, and Bonds were much higher on Jobs weakness…
We Buy the strongest Leaders that make new highs, on pull-backs. So follow the Green Line System and you should continue to win more than you lose. SEE WATCH LIST
With the Green Line System, your Money should flow into the Strongest areas and your Account value should be able to grow in both Bull and Bear Markets. Follow the MONEY, not the MEDIA.
______________________________________________________________________________
For the week the Dow was up 0.95%, the S&P 500 was up 1.57% and the NASDAQ 100 was up 1.84%. The major Indices still have a Relative Strength below 80, so you should currently own the stronger Funds here.
The Inflation Index (CRB) was up 1.33% this week and is Above the Green Line, indicating Economic Expansion.
Bonds were up 1.57% for the week, and are Above the Green Line, indicating Economic Contraction.
The US DOLLAR was down 0.16% for the week.
Crude Oil was up 1.10% for the week at $62.55 and GOLD was up 1.39% at $3642.37.
_______________________________________________________________________
DAY TRADERS: We are doing many profitable Day Trades at our Live Trading Room on YouTube during Market hours. Please join Discord or X (Twitter) with your cell phone app for the fastest Trade Alerts and Daily email notifications during the day. Other methods of notification have been too slow.
_______________________________________________________________________
SWING TRADE COMPLETED TRADES:
APLD Applied Digital Target was Hit $16.50 with a 8.6% Gain
HOOD Robinhood Mkts. Target was Hit at $115 with a 14% Gain.
NVDA NVIDIA CORP. Target was Hit at $180 with a 7.8% Gain.
We are now in 4 Three Star logged Swing Trading Positions for the Short Term. There are 3 investments on the Short Term Watch List.
Completed Swing Trades thru Aug 2025: 164 Trades, + 422% Total. Avg. Trade = 2.58 % Gain (before taxes and commissions).
______________________________________________________________________________
WEEKLY SWING (GREEN ZONE POPS) WATCH LIST
| Open Date | Symbol | Description | Industry | SCTR | Size | Last Price | Daily Change % | ATGL 60 Min | Comments | id | Strategy | Position | Sell Date | Sell Price | Purchase Price | Net Profit | Realized Gain/Loss % | ATGL Rule | Stop Loss | color | Chart | Update Date | Status | Unrealized Gain/Loss % | Volume | Post Type | # Shares | Amount Invested | Portfolio Weight | Dividend Rate | Current Yield | Current Value | Yield on Cost | Projected Annual Dividends | Total Dividends Received | Pay Back | Profit / Loss | Annualized Profit/Loss | Star Rating | Target Price | News Alert % | Target Triggered |
|---|---|---|---|---|---|---|---|---|---|---|---|---|---|---|---|---|---|---|---|---|---|---|---|---|---|---|---|---|---|---|---|---|---|---|---|---|---|---|---|---|---|---|
| 2026-06-17 | USO | US Oil Fund | Energy | 92 | ETF | $114.28 | -0.5136 | Wait for next Weekly Money Wave Close > 20 with High Volume. | 5092 | Long Term | Long | $0.00 | 0.00% | https://stockcharts.com/sc3/ui/?s=USO&a=2293225295&p=W&yr=1&mn=6&dy=0&id=p78387113253 | 2026-06-18 15:54:20 | open | 0.00% | 0 | Watch List | $0 | 0.00% | 0.00 | 0 | $0 | 0.00% | $0 | $0 | 0.00% | 0.00% | - | $135.00 | |||||||||||
| 2026-06-07 | SLV | Silver Fund | Metals | 93 | ETF | $59.05 | -0.773 | Wait for next Weekly Money Wave Close > 20 with High Volume. | 5083 | Long Term | Long | $0.00 | 0.00% | https://stockcharts.com/sc3/ui/?s=SLV&a=2284537971&p=W&yr=1&mn=6&dy=0&id=p52385594523 | 2026-06-08 19:47:29 | open | 0.00% | 0 | Watch List | $0 | 0.00% | 0.00 | 0 | $0 | 0.00% | $0 | $0 | 0.00% | 0.00% | - | $80.00 | |||||||||||
| 2026-05-26 | CTMX | Cytomx Thera. | HealthCare | 83 | Small | $2.96 | 0.1695 | Wait for next Weekly Money Wave Close > 20 with High Volume. | 5071 | Long Term | Long | $0.00 | 0.00% | https://stockcharts.com/sc3/ui/?s=CTMX&a=2273899296&p=W&yr=1&mn=0&dy=0&id=p89336138870 | 2026-05-26 19:08:23 | open | 0.00% | 0 | Watch List | $0 | 0.00% | 0.00 | 0 | $0 | 0.00% | $0 | $0 | 0.00% | 0.00% | - | $5.50 |
Weekly Green Zone Pops- Click here for scrolling charts.
WEEKLY SWING (GREEN ZONE POP) TRADES
AEVA Aeva Tech. Weekly Swing Trade Pop was good for 14.9 %. Target is $24.
PDYN Palladyne AI Weekly Swing Trade Pop was good for 8 %. Target is $11.50.
KC KingSoft Cloud Slipped down to the Buy Price and were Stopped Out even.
Completed Weekly Swing Trades thru Aug 2025: 24 Trades, +494% Total, or 20.6 % / Trade (before taxes & commissions).
______________________________________________________________________________
Important Links| Top 100 | Stage Chart Investing | CNN Fear & Greed Index |
| Dividend Growth Portfolio | ETF Sector Portfolio | Dogs of the Dow |
| Long Term Strategy | Stage Chart Investing | Articles |
Alert! Market Risk is Medium (Yellow). The probability of successful Short Term Trades is better, when the % of stocks above the 50-day avg. is below 20.
Tell your Friends about the Green Line, and Help Animals.
______________________________________________________________________________
QUESTION: Brian writes ” Is there anyway to make your strategy work in the German markets or the forex game. Like things without sctr values?”
ANSWER: Yes Brian, the Green Line System works with ALL Investments and Mutual Funds that can be Charted.
If there is no Symbol, you can manually make a Chart like we did before computers existed. Make sure the Investment stays Above the Green Line (250 day ema).
Determining Relative Strength would be trickier. Most Relative Strength systems use computers to compare the Investment to the S&P 5oo index, or to all Investments that are in the database.
