The Top Pick of the Week was Sold on the Gap Up on Tuesday’s Open for a 4 % conservative Gain, and an 8 % aggressive Gain.
In 2026 the Top Pick Strategy had 3 trades totalling 14.6%, while the S&P 500 was down 1.3 %.
For busy investors that don’t have time to Swing Trade, we now have a simple Strategy:
Top Pick of the Week. You Buy the “Pick” on Monday morning, and then Sell on Friday’s Close. It’s a time-efficient approach designed to capture short-term gains without requiring constant market monitoring.
This “Pick” is emailed to you with this Weekly Commentary (see Pick below & more details here).
The Top Pick of the Week is: Amer. Xtal Tech. $AXTI to Buy on the Open Monday and Sell on the Close Friday.
You can view the superior Weekly Stock Performance.
______________________________________________________________________________
DAILY SWING TRADING (SHORT TERM)Watch List and Charts to Buy Soon.
| Daily Swing Watch List to Buy | Daily Swing Charts to Buy |
| Current Daily Swing Positions | Current Swing Charts |
| Closed Daily Swing Results | Trading Dashboard |
1/25/2026 Markets were mostly lower for the week after the Indices struggled from being very stretched out. But a few of the Strongest Leaders continued to make higher highs (MU SMH SNDK SLV & GDX). The Leaders are quickly back up in the Red Zones (probably too late to Buy for the short term). Swing Trades are not bouncing up well as the Markets are tired.
The FED has Cut short term Interest Rales, but this excess liquidity has caused the Metals: Gold Copper Aluminium & Silver to blow out on Inflation Fears. Wait to Buy the strong Metals on pull-backs.The major Stocks Indices are struggling up here, as historically most Stocks are very expensive now.
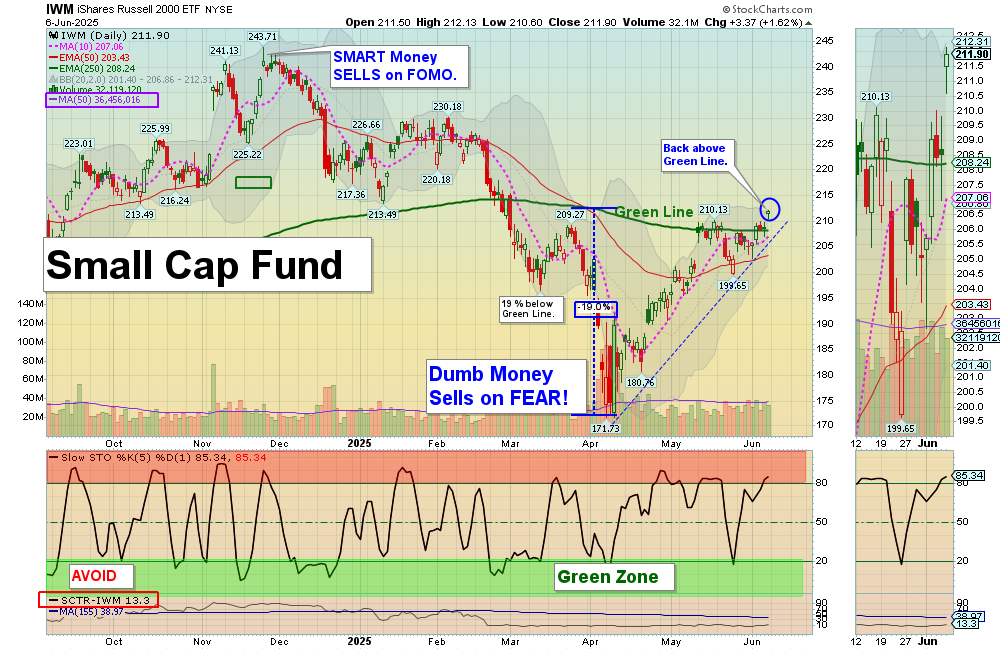
If you will need CASH in the next year, probably take some profits and WAIT for another FEAR Flush by the Magician / Media, to scare out the Dumb Money who Buys at the TOP (Markets have had a huge rally from the April lows).
We Buy the strongest Leaders that make new highs, on pull-backs. So follow the Green Line System and you should continue to win more than you lose. SEE WATCH LIST
With the Green Line System, your Money should flow into the Strongest areas and your Account value should be able to grow in both Bull and Bear Markets. Follow the MONEY, not the MEDIA.
______________________________________________________________________________
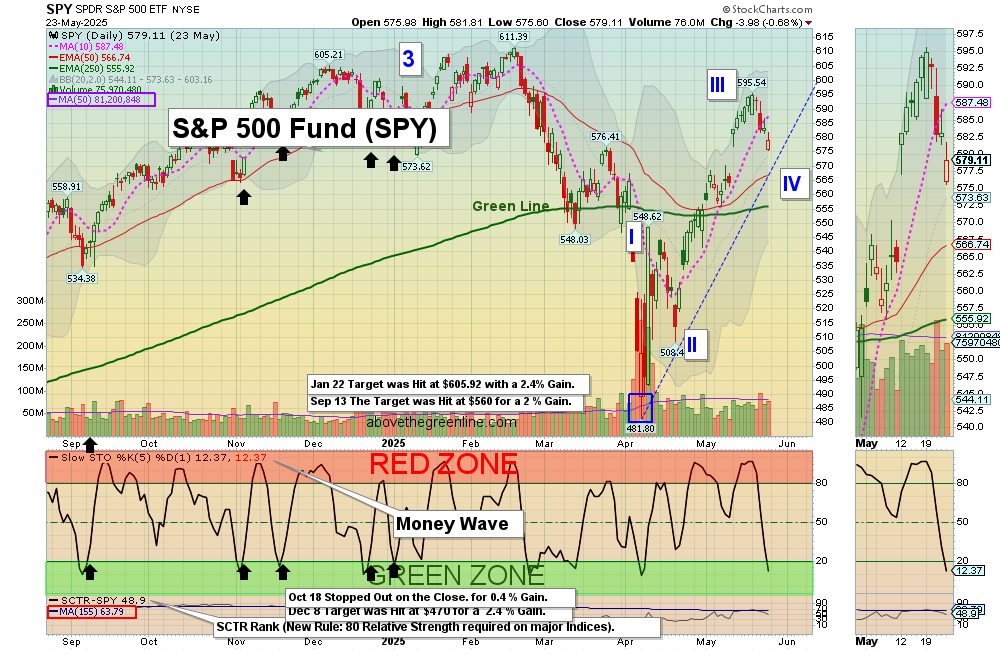
For the week the Dow was down 0.50%, the S&P 500 was down 0.35% and the NASDAQ 100 was up 0.23%. Try to own the stronger Funds here.
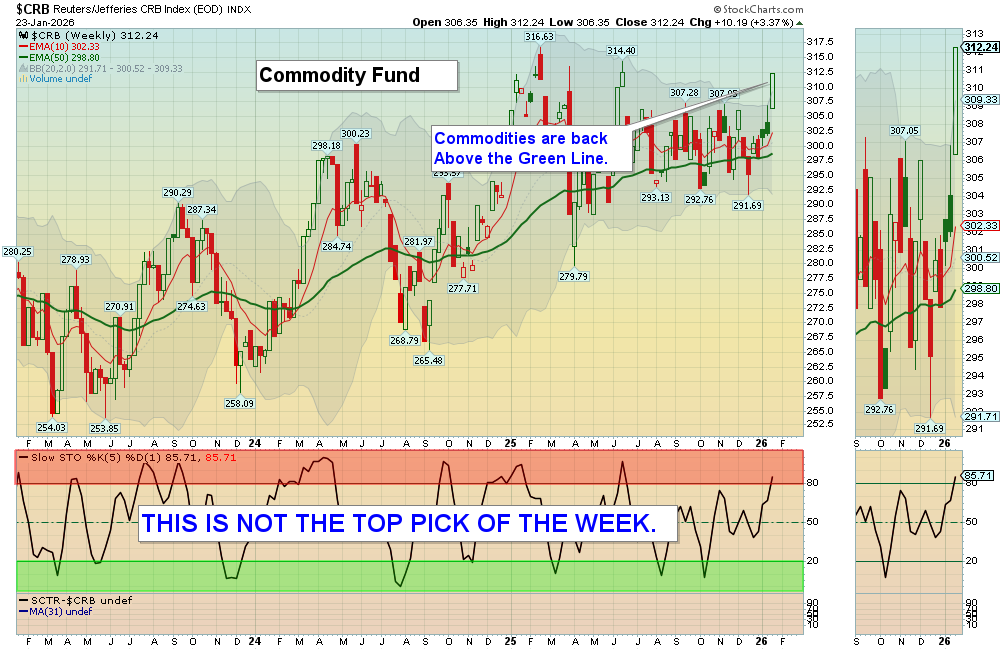
The Inflation Index (CRB) was up 3.31%% this week and is Above the Green Line, indicating Economic Expansion.
Bonds were down 0.15% for the week, and are Above the Green Line, indicating Economic Expansion.
The US DOLLAR was down 1.95% for the week.
Crude Oil was up 3.27 % for the week at $61.28 and GOLD was up 8.58% at $4989.23.
_______________________________________________________________________
DAY TRADERS: We are doing many profitable Day Trades at our Live Trading Room on YouTube during Market hours. Please join Discord or X (Twitter) with your cell phone app for the fastest Trade Alerts and Daily email notifications during the day. Other methods of notification have been too slow.
_______________________________________________________________________
COMPLETED DAILY SWING TRADE TRADES: NONE
We are now in 2 Three Star logged Swing Trading Positions for the Short Term. There are 3 investments on the Short Term Watch List.
Completed Swing Trades in 2025: 243 Trades, or 3.21% Avg. / Trade (before taxes and commissions). ______________________________________________________________________________
WEEKLY SWING TRADES – WATCH LIST
| Open Date | Symbol | Description | Industry | SCTR | Size | Last Price | Daily Change % | ATGL 60 Min | Comments | id | Strategy | Position | Sell Date | Sell Price | Purchase Price | Net Profit | Realized Gain/Loss % | ATGL Rule | Stop Loss | color | Chart | Update Date | Status | Unrealized Gain/Loss % | Volume | Post Type | # Shares | Amount Invested | Portfolio Weight | Dividend Rate | Current Yield | Current Value | Yield on Cost | Projected Annual Dividends | Total Dividends Received | Pay Back | Profit / Loss | Annualized Profit/Loss | Star Rating | Target Price | News Alert % | Target Triggered |
|---|---|---|---|---|---|---|---|---|---|---|---|---|---|---|---|---|---|---|---|---|---|---|---|---|---|---|---|---|---|---|---|---|---|---|---|---|---|---|---|---|---|---|
| 2026-06-21 | CVE | Cenovus Energy | Energy | 84 | Mid | $24.69 | -4.0793 | Wait for next Weekly Money Wave Close > 20 with High Volume. | 5095 | Long Term | Long | $0.00 | 0.00% | https://stockcharts.com/sc3/ui/?s=CVE&a=1003009129&p=W&yr=1&mn=0&dy=0&id=p88523581588 | 2026-06-22 05:03:07 | open | 0.00% | 10914781 | Watch List | $0 | 0.00% | 0.57 | 2.2991 | $0 | 0.00% | $0 | $0 | 0.00% | 0.00% | - | $29.00 | |||||||||||
| 2026-06-17 | USO | US Oil Fund | Energy | 92 | ETF | $106.26 | -4.494 | Wait for next Weekly Money Wave Close > 20 with High Volume. | 5092 | Long Term | Long | $0.00 | 0.00% | https://stockcharts.com/sc3/ui/?s=USO&a=2293225295&p=W&yr=1&mn=6&dy=0&id=p78387113253 | 2026-06-18 15:54:20 | open | 0.00% | 4924213 | Watch List | $0 | 0.00% | 0.00 | 0 | $0 | 0.00% | $0 | $0 | 0.00% | 0.00% | - | $135.00 | |||||||||||
| 2026-06-07 | SLV | Silver Fund | Metals | 93 | ETF | $51.79 | -7.0788 | Wait for next Weekly Money Wave Close > 20 with High Volume. | 5083 | Long Term | Long | $0.00 | 0.00% | https://stockcharts.com/sc3/ui/?s=SLV&a=2284537971&p=W&yr=1&mn=6&dy=0&id=p52385594523 | 2026-06-08 19:47:29 | open | 0.00% | 49416442 | Watch List | $0 | 0.00% | 0.00 | 0 | $0 | 0.00% | $0 | $0 | 0.00% | 0.00% | - | $80.00 | |||||||||||
| 2026-05-26 | CTMX | Cytomx Thera. | HealthCare | 83 | Small | $3.33 | 5.5556 | Wait for next Weekly Money Wave Close > 20 with High Volume. | 5071 | Long Term | Long | $0.00 | 0.00% | https://stockcharts.com/sc3/ui/?s=CTMX&a=2273899296&p=W&yr=1&mn=0&dy=0&id=p89336138870 | 2026-05-26 19:08:23 | open | 0.00% | 4657170 | Watch List | $0 | 0.00% | 0.00 | 0 | $0 | 0.00% | $0 | $0 | 0.00% | 0.00% | - | $5.50 |
Weekly Green Zone Pops – Click here for scrolling charts.
WEEKLY SWING TRADES
AMPX Amprius Tech. Sold via Trade Alert at $11.50 for a 14.9 % Gain.
OCUL Ocular Thera. Weekly Swing Trade Buy. Target is $13.50.
Completed Weekly Swing Trades in 2025: 44 Trades, or 16 % / Trade (before taxes & commissions).
______________________________________________________________________________
Important Links| Top 100 | Stage Chart Investing | CNN Fear & Greed Index |
| Dividend Growth Portfolio | ETF Sector Portfolio | Dogs of the Dow |
| Long Term Strategy | Stage Chart Investing | Articles |
Alert! Market Risk is Medium (Yellow). The probability of successful Short Term Trades is better, when the % of stocks above the 50-day avg. is below 20.
Tell your Friends about the Green Line, and Help Animals.
______________________________________________________________________________
QUESTION: Nancy writes “I would like to know where the Relative Strength factor is located on the charts.”
ANSWER: Hi Nancy, the Relative Strength is usually on the bottom left of each Chart with a Red Box around it (SCTR is StockCharts Technical Rank).
Relative Strength Values comes from the SCTR Rank (StockCharts Technical Rank), MarketInOut.com and Investor’s Business Daily (IBD). We prefer the longer term weighting used by MarketInOut.com and IBD. But the SCTR Rank is very convenient since it is on the lower left of most daily charts.
We sometimes use a 155-day avg. of StockCharts SCTR, which is at the bottom left of many charts (just below the SCTR Rank) to simulate Relative Strength closer to the longer-term ranking of 1 year IBD ranking.We want longer term Momentum, not the shorter 90-day weighting of SCTR Rank
Good trading, and tell your friends!
AGTL