
By ATGL
Updated July 30, 2025
Success in trading demands the ability to recognize profitable patterns before they complete their formation. Among the most reliable bullish formations, the Ascending Staircase Pattern stands out as a powerful signal of sustained upward momentum. This pattern represents one of the clearest examples of how price action reveals market psychology and trader sentiment.
Professional traders who master day trading patterns understand that the Ascending Staircase formation offers exceptional risk-reward opportunities. This comprehensive guide will teach you to identify the pattern, understand its formation mechanics, and implement effective trading strategies around it. You’ll learn to spot the pattern early, confirm it with technical indicators, and manage risk while maximizing profit potential.
What Is the Ascending Staircase Pattern?
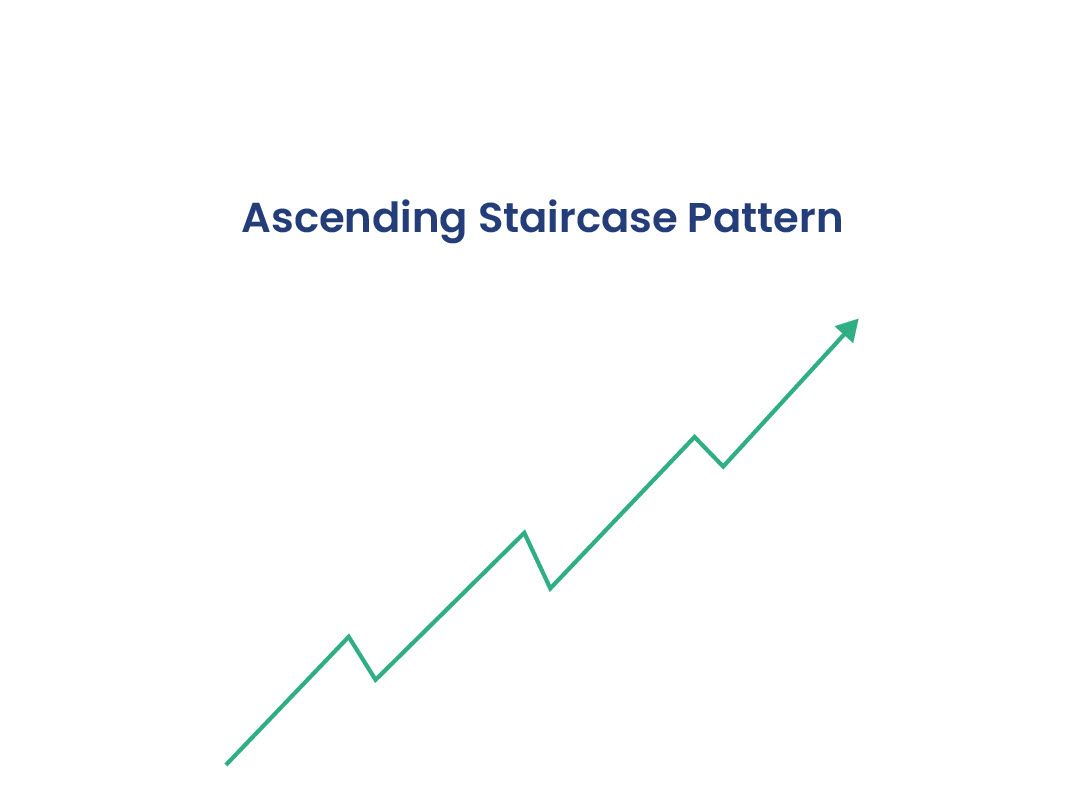
The Ascending Staircase Pattern emerges when price creates a series of higher highs and higher lows, resembling steps climbing upward on a chart. This staircase chart pattern forms during strong uptrends as bulls repeatedly push price to new highs, while each pullback finds support at progressively higher levels.
The pattern appears when buying pressure consistently overcomes selling pressure, creating distinct “steps” where each rally reaches a higher peak than the previous one, and each correction bottoms at a higher low. This systematic advance signals that demand exceeds supply at increasingly elevated price levels, establishing a foundation for continued bullish movement.
How the Staircase Chart Pattern Forms
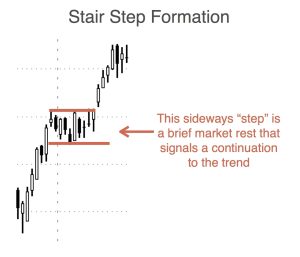
The staircase chart pattern develops through repeated rally-retrace cycles that build upon each other. Initially, price breaks above a resistance level and advances sharply higher. After this initial thrust, profit-taking causes a temporary pullback, but buyers step in before the price returns to the original breakout point.
This creates the first “step” of the pattern. The cycle repeats as renewed buying interest drives the price to an even higher peak, followed by another pullback that again finds support above the previous low. Each successive rally and retracement creates another step in the ascending staircase, with volume typically expanding during rallies and contracting during pullbacks.
The pattern strengthens with each completed step, as the higher lows demonstrate that sellers lack the conviction to drive the price back to previous support levels. This price action reveals growing confidence among market participants and suggests the underlying trend possesses genuine strength.
Why the Ascending Staircase Pattern Signals Strength
The pattern’s power lies in its demonstration of consistent buying interest at progressively higher prices. When traders willingly purchase shares at each new high, they signal confidence that current prices represent value relative to future expectations. This behavior creates a self-reinforcing cycle where successful breakouts attract additional buyers.
The higher lows component proves equally significant for technical analysis. Each pullback that holds above the previous correction shows that selling pressure weakens while buying support strengthens. This dynamic indicates that supply has been absorbed by willing buyers, clearing the path for further advances.
Professional traders recognize this pattern because it reflects genuine accumulation rather than speculative buying. The stepped advance allows institutional investors to build positions without driving price too far too fast, creating sustainable uptrends that can persist for extended periods.
How To Identify the Pattern in Real Time
Successful pattern recognition requires monitoring specific price behaviors as they develop. The skill of identifying trends in stock charts becomes crucial when watching for strong breakouts above resistance levels, followed by orderly pullbacks that hold well above the breakout point. The pullbacks should show decreasing volatility and volume compared to the initial advance.
Key identification criteria include measuring the depth of each retracement — healthy ascending staircases typically see pullbacks of 30% to 50% of the prior advance. Deeper retracements may signal weakness, while shallow pullbacks might indicate unsustainable momentum that could lead to sharp reversals.
Pay attention to how the price behaves at each new high. Strong patterns show price consolidating briefly at resistance before breaking higher, rather than immediately reversing. This consolidation allows the pattern to build the foundation necessary for the next leg up.
Volume analysis provides crucial confirmation during pattern development. Legitimate ascending staircases display expanding volume during rallies and contracting volume during pullbacks, demonstrating that buying interest drives the advances while selling pressure remains limited.
Using Indicators To Confirm the Staircase Chart Pattern
Several technical indicators work effectively to confirm ascending staircase formations. Moving averages provide excellent trend confirmation. Look for price holding above rising 20-day and 50-day moving averages during the pattern’s development.
The Relative Strength Index (RSI) should remain above 50 throughout the pattern, with each new high accompanied by RSI readings above 60. Avoid patterns where RSI shows negative divergence by making lower highs while price creates higher highs.
MACD offers additional confirmation when the signal line stays above the zero line and the histogram shows expanding positive momentum during rallies. The pattern gains credibility when MACD remains in bullish territory throughout the formation.
Momentum oscillators like Stochastic should reset to oversold levels during pullbacks before turning higher ahead of the next rally phase. This behavior confirms that corrections represent healthy profit-taking rather than trend reversals.
Riding the Stairs: How To Trade the Ascending Staircase Pattern
Effective trading of this pattern involves multiple entry strategies depending on your risk tolerance and timing preferences. Whether implementing short-term tactics or longer-term investment strategies, conservative traders can enter on breakouts above each new high, placing stop losses below the most recent higher low. This approach maximizes the probability of success while accepting potentially smaller position sizes due to wider stops.
Aggressive traders may purchase during pullbacks when the price approaches the rising trendline connecting the higher lows. This strategy offers better risk-reward ratios but requires precise timing and strong pattern recognition skills.
Position sizing becomes critical when trading ascending staircases, as the pattern often develops over several weeks or months. Consider scaling into positions during multiple pullbacks rather than committing full capital at once. This approach allows you to build larger positions in strong trends while maintaining flexibility.
Exit strategies should account for the pattern’s eventual completion. Watch for pullbacks that break below the ascending trendline of higher lows, volume patterns that shift toward selling dominance, or momentum indicators that show persistent negative divergence.
Staircase Pattern Mistakes Traders Make (and How To Avoid Them)
The most common error involves forcing the pattern recognition when price action doesn’t clearly support it. True ascending staircases require at least three distinct steps (higher highs and higher lows) to establish validity. Don’t assume a pattern exists after just one or two price swings.
Another frequent mistake involves ignoring volume confirmation. Patterns that develop on declining volume often fail because they lack genuine buying interest. Always verify that advances occur on expanding volume while pullbacks show contraction.
Traders also err by placing stops too close to current price action. Ascending staircases need room to breathe during normal pullbacks. Place protective stops below significant support levels rather than just below recent lows to avoid premature exit from profitable trends.
Finally, avoid holding positions after the pattern shows clear signs of failure. When pullbacks begin exceeding 60% to 70% of prior advances or break below the ascending trendline, the pattern likely has run its course regardless of your original profit targets.
Start Spotting Strong Trends With the Ascending Staircase Pattern
Join our community of successful traders who use these proven techniques daily. Discover our comprehensive training programs at Above the Green Line and start building the skills that separate profitable traders from the crowd. Your journey toward consistent trading success starts with recognizing the patterns that create wealth — and the Ascending Staircase Pattern stands among the most powerful tools in your arsenal.

Related Articles

Margin Call Explained: What Triggers It and How to Avoid One

AMC Short Squeeze Explained: Timeline, Causes, and Trading Risks

Volatility Clustering in Financial Markets: Understand Why It Happens

Chaikin Money Flow (CMF): How to Use Volume to Spot Real Market Strength
