
So far In 2026 the Top Pick Strategy had 8 trades totaling +28.5%, while the S&P 500 was down -2 %.
For busy investors that don’t have time to Swing Trade, we now have a simple Strategy:
Top Pick of the Week. You Buy the “Pick” on Monday morning, and then Sell on Friday’s Close. It’s a time-efficient approach designed to capture short-term gains without requiring constant market monitoring.
This “Pick” is emailed to you with this Weekly Commentary (see Pick below & more details here).
The Top Pick of the Week is: Corning Inc. $GLW to Buy on the Open Monday and Sell on the Close Friday.
You can view the superior Weekly Stock Performance.
______________________________________________________________________________
DAILY SWING TRADING (SHORT TERM)Watch List and Charts to Buy Soon.
| Daily Swing Watch List to Buy | Daily Swing Charts to Buy |
| Current Daily Swing Positions | Current Swing Charts |
| Closed Daily Swing Results | Trading Dashboard |
3/08/2026 Markets were sharply lower for the week, as Crude Oil shot up 36 % on War Fears. When FEAR is High, we like to BUY. Dumb Money bought on the Highs in January with borrowed money, and now they are having to Sell from Margin Calls. Many of the Tech & Momentum Stocks have dropped 30-50 % (probably too late to Sell). Now there is Opportunity for Gains for those who Buy with Smart Money on Fear (Dumb Money is Selling as Magician / Media is scaring them out).
The over-sold Software Fund (IGV) did bounce up 8 % for the week, as money rotated into Value Stocks.
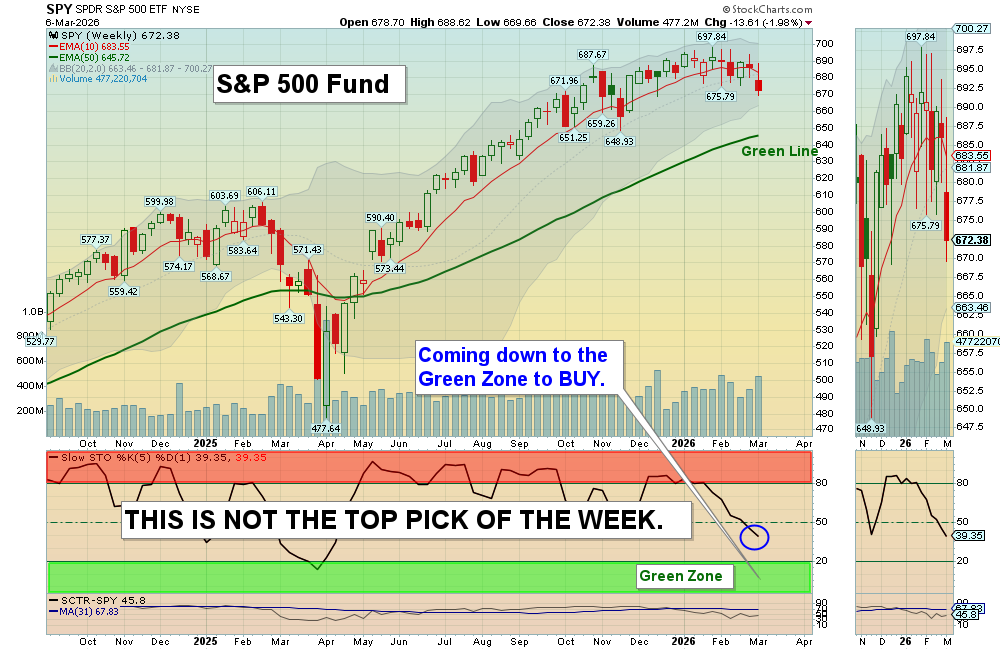
The major Stocks Indices are now coming back down to the Green Lines (like they always do) after the temporary Greed and FOMO (panic Buying) subsides. We are waiting on this CHART to come back down in the Green Zone, which historically creates maybe a “Once a Year” Buying Opportunity.
We Buy the strongest Leaders that make new highs, on pull-backs. So follow the Green Line System and you should continue to win more than you lose. SEE WATCH LIST
With the Green Line System, your Money should flow into the Strongest areas and your Account value should be able to grow in both Bull and Bear Markets. Follow the MONEY, not the MEDIA.
______________________________________________________________________________
For the week the Dow was down 2.95%, the S&P 500 was down 2.02% and the NASDAQ 100 was down 1.24%. Try to own the stronger Funds here.
The Inflation Index (CRB) was up 12.62 % this week and is Above the Green Line, indicating Economic Expansion.
Bonds were down 2.28% for the week, and are Above the Green Line, indicating Economic Contraction.
The US DOLLAR was up 1.29% for the week.
Crude Oil was up 36.18 % for the week at $91.27 and GOLD was down 2.53% at $5144.28.
_______________________________________________________________________
DAY TRADERS: We are doing many profitable Day Trades at our Live Trading Room on YouTube during Market hours. Please join Discord or X (Twitter) with your cell phone app for the fastest Trade Alerts and Daily email notifications during the day. Other methods of notification have been too slow.
_______________________________________________________________________
COMPLETED DAILY SWING TRADES:
SBSW Sibanye Stillwater Sold via Trade Alert at $17.10 for a 7.3% Gain.
We are now in 1 Three Star logged Swing Trading Positions for the Short Term. There are 4 investments on the Short Term Watch List.
Completed Swing Trades in 2025: 243 Trades, or 3.21% Avg. / Trade (before taxes and commissions). ______________________________________________________________________________
WEEKLY SWING TRADES – WATCH LIST
| Open Date | Symbol | Description | Industry | SCTR | Size | Last Price | Daily Change % | ATGL 60 Min | Comments | id | Strategy | Position | Sell Date | Sell Price | Purchase Price | Net Profit | Realized Gain/Loss % | ATGL Rule | Stop Loss | color | Chart | Update Date | Status | Unrealized Gain/Loss % | Volume | Post Type | # Shares | Amount Invested | Portfolio Weight | Dividend Rate | Current Yield | Current Value | Yield on Cost | Projected Annual Dividends | Total Dividends Received | Pay Back | Profit / Loss | Annualized Profit/Loss | Star Rating | Target Price | News Alert % | Target Triggered |
|---|---|---|---|---|---|---|---|---|---|---|---|---|---|---|---|---|---|---|---|---|---|---|---|---|---|---|---|---|---|---|---|---|---|---|---|---|---|---|---|---|---|---|
| 2026-06-21 | CVE | Cenovus Energy | Energy | 84 | Mid | $25.74 | 0.2727 | Wait for next Weekly Money Wave Close > 20 with High Volume. | 5095 | Long Term | Long | $0.00 | 0.00% | https://stockcharts.com/sc3/ui/?s=CVE&a=1003009129&p=W&yr=1&mn=0&dy=0&id=p88523581588 | 2026-06-22 05:03:07 | open | 0.00% | 4057336 | Watch List | $0 | 0.00% | 0.59 | 2.2991 | $0 | 0.00% | $0 | $0 | 0.00% | 0.00% | - | $29.00 | |||||||||||
| 2026-06-17 | USO | US Oil Fund | Energy | 92 | ETF | $111.26 | -1.269 | Wait for next Weekly Money Wave Close > 20 with High Volume. | 5092 | Long Term | Long | $0.00 | 0.00% | https://stockcharts.com/sc3/ui/?s=USO&a=2293225295&p=W&yr=1&mn=6&dy=0&id=p78387113253 | 2026-06-18 15:54:20 | open | 0.00% | 3153858 | Watch List | $0 | 0.00% | 0.00 | 0 | $0 | 0.00% | $0 | $0 | 0.00% | 0.00% | - | $135.00 | |||||||||||
| 2026-06-07 | SLV | Silver Fund | Metals | 93 | ETF | $55.73 | -5.3981 | Wait for next Weekly Money Wave Close > 20 with High Volume. | 5083 | Long Term | Long | $0.00 | 0.00% | https://stockcharts.com/sc3/ui/?s=SLV&a=2284537971&p=W&yr=1&mn=6&dy=0&id=p52385594523 | 2026-06-08 19:47:29 | open | 0.00% | 20777788 | Watch List | $0 | 0.00% | 0.00 | 0 | $0 | 0.00% | $0 | $0 | 0.00% | 0.00% | - | $80.00 | |||||||||||
| 2026-05-26 | CTMX | Cytomx Thera. | HealthCare | 83 | Small | $3.15 | 3.6184 | Wait for next Weekly Money Wave Close > 20 with High Volume. | 5071 | Long Term | Long | $0.00 | 0.00% | https://stockcharts.com/sc3/ui/?s=CTMX&a=2273899296&p=W&yr=1&mn=0&dy=0&id=p89336138870 | 2026-05-26 19:08:23 | open | 0.00% | 3554161 | Watch List | $0 | 0.00% | 0.00 | 0 | $0 | 0.00% | $0 | $0 | 0.00% | 0.00% | - | $5.50 |
Weekly Green Zone Pops – Click here for scrolling charts.
WEEKLY SWING TRADES
PLTR Palantir Tech. Weekly Swing Buy this week was up 14.5 %. Target is $180.
RKLB Rocket Lab USA Weekly Swing Buy this week. Target is $85.
OCUL Ocular Thera. Stopped out via Trade Alert at $11.25 for a -1.75 % Loss.
Completed Weekly Swing Trades in 2025: 44 Trades, or 16 % / Trade (before taxes & commissions).
______________________________________________________________________________
Important Links| Top 100 | Stage Chart Investing | CNN Fear & Greed Index |
| Dividend Growth Portfolio | ETF Sector Portfolio | Dogs of the Dow |
| Long Term Strategy | Stage Chart Investing | Articles |
Alert! Market Risk is Medium (Yellow). The probability of successful Short Term Trades is better, when the % of stocks above the 50-day avg. is below 20.
Tell your Friends about the Green Line, and Help Animals.
______________________________________________________________________________
QUESTION: Juanita writes “Does the ATGL website list previously posted (or all) “recent comments,” not just the two to three most current ones? I find reading those comments and replies very helpful, but I frequently miss them because I am not on the computer trading every day. Is there somewhere on the website I can find older postings to review?”
ANSWER: Yes Juanita, all emails are available on the Main Menu of the web site under Commentary for weekly, and Daily for Daily.
Good trading and tell your friends!
ATGL
