Watch List and Charts to Buy Soon.
| Daily Swing Watch List to Buy | Daily Swing Charts to Buy |
| Current Daily Swing Positions | Current Swing Charts |
| Closed Daily Swing Results | Trading Dashboard |
Current Pick and Chart
| Top Pick of the Week | TPOW Stock Chart |
The Markets will Close early at 1:00 pm today.
The Top Pick of the Week: Rigetti Computing Inc. $RGTI was already Sold on Monday, for a Solid 4% gain (Conservative Target) and 8 % (Aggressive Target).
Nov 28, 2025 Today the markets opened on a stronger side, with SPY moving upward at the open, but despite the bounce, smart money is not buying in the daily red zone, indicating that it’s too late for quality swing entries. Volume remained low and no fresh highs were made, suggesting the upside wave is still weak. The week began on a bearish note, and while the market rebounded, the move lacked strong conviction.
We had already sold our TPOW on Monday and booked solid gains, and with today being a half-day session and markets closed on 1pm, we took a weekly swing buy on TMC along with a few daily swing buys setups. Many of our open swing positions are being managed conservatively—either avoiding losses or adjusting targets lower—as overall market sentiment remained mixed and somewhat weak into the close.
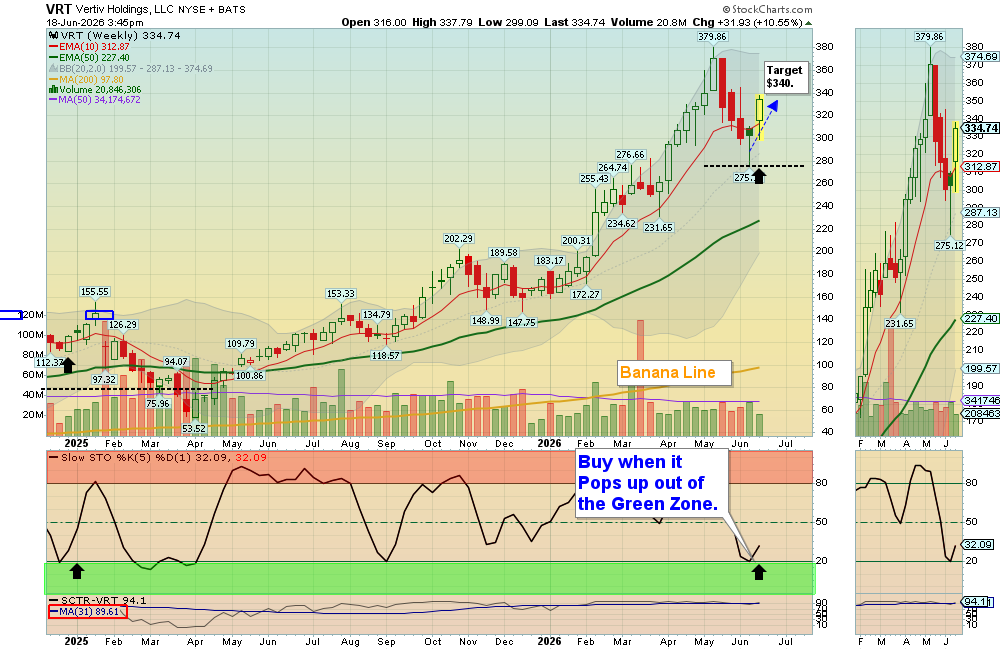
Wait for more Buy Signals coming up out of the Green Zones. WATCH LIST CHARTS
The best moves happen when the S&P 500 Index is also coming up out of the Green Zone.
______________________________________________________________________________
BUYS TODAY 11/28/2025
IVVD Invivyd Inc Swing Trade Buy on the Close, but its already up 4% (2 Star Trade).
PGEN Precigen Inc Swing Trade Buy on the Close, but the Volume is not high (2 Star Trade).
BUYS SOON
| Open Date | Symbol | Description | SCTR | Last Price | Daily Change % | Comments | ATGL 60 Min | id | Strategy | Position | Sell Date | Sell Price | Purchase Price | Net Profit | Realized Gain/Loss % | ATGL Rule | Industry | Size | Stop Loss | color | Chart | Update Date | Status | Unrealized Gain/Loss % | Volume | Post Type | # Shares | Amount Invested | Portfolio Weight | Dividend Rate | Current Yield | Current Value | Yield on Cost | Projected Annual Dividends | Total Dividends Received | Pay Back | Profit / Loss | Annualized Profit/Loss | Star Rating | Target Price | News Alert % | Target Triggered |
|---|---|---|---|---|---|---|---|---|---|---|---|---|---|---|---|---|---|---|---|---|---|---|---|---|---|---|---|---|---|---|---|---|---|---|---|---|---|---|---|---|---|---|
| 2026-06-18 | APPS | Digital Turbine Inc. | 96 | $8.59 | -0.2323 | Wait for next Daily Money Wave Close > 20 with High Volume. | 5093 | Short Term | Long | $0.00 | 0.00% | Software | Small | https://stockcharts.com/sc3/ui/?s=APPS&a=2293191731&p=D&yr=0&mn=4&dy=0&id=p58001660323 | 2026-06-21 19:13:01 | open | 0.00% | 0 | Watch List | $0 | 0.00% | 0.00 | 0 | $0 | 0.00% | $0 | $0 | 0.00% | 0.00% | - | $10.00 | |||||||||||
| 2026-06-17 | RXO | RXO Inc. | 92 | $25.36 | -0.1182 | Wait for next Daily Money Wave Close > 20 with High Volume. | 5091 | Short Term | Long | $0.00 | 0.00% | Transport | Small | https://stockcharts.com/sc3/ui/?s=RXO&a=2292341458&p=D&yr=0&mn=4&dy=0&id=p19522285398 | 2026-06-17 19:11:32 | open | 0.00% | 0 | Watch List | $0 | 0.00% | 0.00 | 0 | $0 | 0.00% | $0 | $0 | 0.00% | 0.00% | - | $28.50 | |||||||||||
| 2026-06-16 | BAND | Bandwidth Inc. | 98 | $51.19 | -0.3892 | Wait for next Daily Money Wave Close > 20 with High Volume. | 5090 | Short Term | Long | $0.00 | 0.00% | Telecom | Small | https://stockcharts.com/sc3/ui/?s=BAND&a=2291301469&p=D&yr=0&mn=4&dy=0&id=p58001660323 | 2026-06-16 16:30:16 | open | 0.00% | 0 | Watch List | $0 | 0.00% | 0.00 | 0 | $0 | 0.00% | $0 | $0 | 0.00% | 0.00% | - | $67.50 | |||||||||||
| 2026-06-14 | RDW | Redwire Corp. | 94 | $14.18 | -1.2195 | Wait for next Daily Money Wave Close > 20 with High Volume. | 5087 | Short Term | Long | $0.00 | 0.00% | AeroSpace | Small | https://stockcharts.com/sc3/ui/?s=RDW&a=2281132577&p=D&yr=0&mn=4&dy=0&id=p21116263806 | 2026-06-14 19:16:51 | open | 0.00% | 0 | Watch List | $0 | 0.00% | 0.00 | 0 | $0 | 0.00% | $0 | $0 | 0.00% | 0.00% | - | $21.00 |
Shop for a better price earlier in the day with Green Candle Buy Signal, on the same day that a Daily Money Wave Buy Signal will occur.
Many like to Buy the Swing Trades just before the Close, if the Money Wave is going to create a Buy Signal (Closing > 20 and up out of the Green Zone). Don’t Buy if the Security has already popped up too much. Money Wave Buy Signals are usually good for a 3-6 % move in a few days.
DAILY SWING SELLS TODAY
INTC Intel Corp. Target was hit at $39.25, securing a 5.4% gain.
IREN IREN Ltd. Slipped down to the Buy Price and was stopped out even.
________________________________________________________________________
WEEKLY SWING TRADE POPS
KTOS Kratos Defense Weekly Swing Trade Buy on the Close. Target is $90.
CDE Coeur Mining Swing Trade Buy on the Close, but it is already up 22 %. AVOID.
TMC The metals company Inc. Swing Trade Buy on the Close, but it is already up 25 %. AVOID.
WEEKLY SWING TRADING (Formerly LONG TERM)Watch List and Charts to Buy Soon.
| Weekly Swing Watch List to Buy | Weekly Swing Charts to Buy |
| Current Weekly Positions | Current Weekly Charts |
| Closed Weekly Swing Trades | Stage Chart Investing |
DAY TRADING SETUPS. Today we had 8 scalp trades for nice Gains at our Trading Room. In this Emotional Market now, Day Trading Alerts are not being sent out on our Discord Site with Live Chatting. Please install Discord app on your PC or cell for mobile notifications. Check out our Live Stream.
Or look for Green Candle Buy Pops (Red Candle turns Green). Big Movers today: BITF +14% CRML +15% & TMC+12%.
Bonds were up today and are Above the Green Line. HAVE A NICE WEEKEND!
Crude Oil was up $0.91 today at $58.56.
MY TRADING DASHBOARD
SWING TRADING CURRENT POSITIONS
DAY TRADING SETUPS
TRADE ALERTS
STAGE CHART INVESTING
TOP 100 STOCKS
HAVE A NICE WEEKEND!