Watch List and Charts to Buy Soon.
| Daily Swing Watch List to Buy | Daily Swing Charts to Buy |
| Current Daily Swing Positions | Current Swing Charts |
| Closed Daily Swing Results | Trading Dashboard |
Current Pick and Chart
| Top Pick of the Week | TPOW Stock Chart |
The Top Pick of the Week: Rigetti Computing Inc. $RGTI was bought at the open today, and popped up nicely and was Sold for a Solid 4% gain (Conservative Target) and 8 % (Aggressive Target).
Nov 24, 2025 Today the markets opened on a stronger side, with SPY moving upward on the open and QQQ following, and SPY briefly meeting the bananas line, though the below-average volume suggests this may be just a corrective wave before another downside retest of lows. The inverse fund SH is trading above the bananas line and also met its fair value, but may likely move up again to form an M pattern.
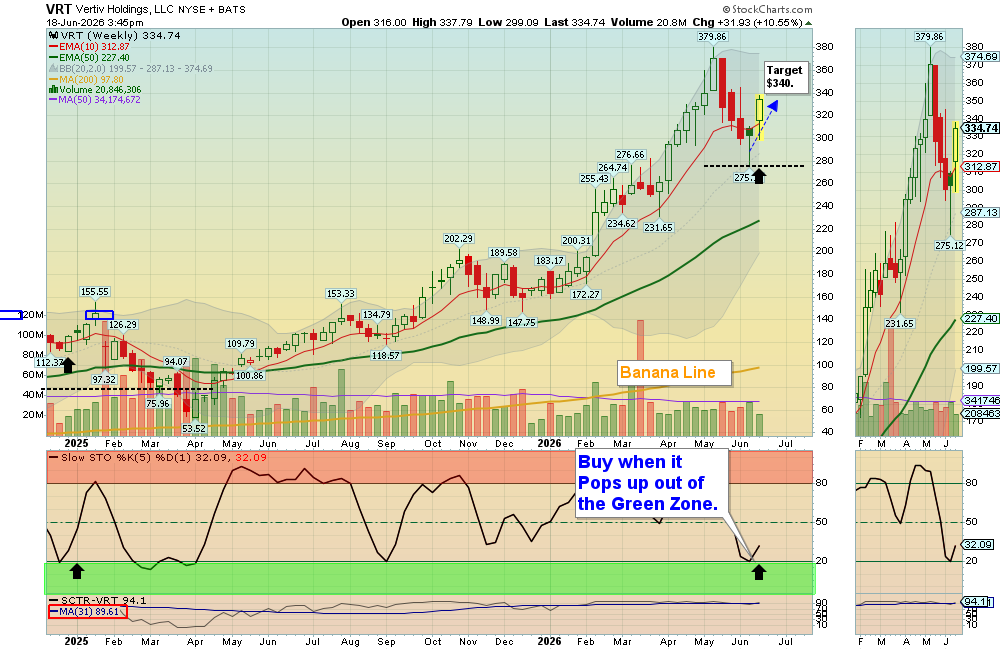
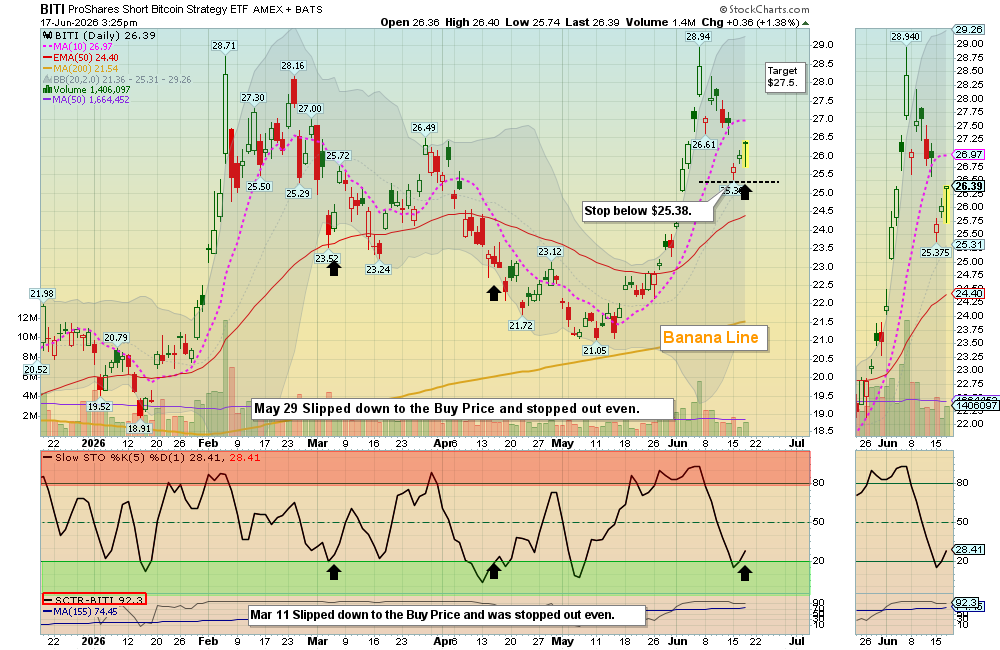
Our TPOW Gain was taken on RGTI at the open, and due to strong conditions we hit the 4% gain target, with many booking profits; ARWR also hit its target at $42 for a 3.8% gain. BITI and BITO both moved toward their fair value bananas line, though spreads remain wide. We took several swing buys into the close, but most names were already up, and the day ultimately ended on a bullish and stronger note.
Wait for more Buy Signals coming up out of the Green Zones. WATCH LIST CHARTS
The best moves happen when the S&P 500 Index is also coming up out of the Green Zone.
______________________________________________________________________________
BUYS TODAY 11/24/2025
LUMN Lumen Tech. Swing Trade Buy on the Close, but the Volume is not high (2 Star trade).
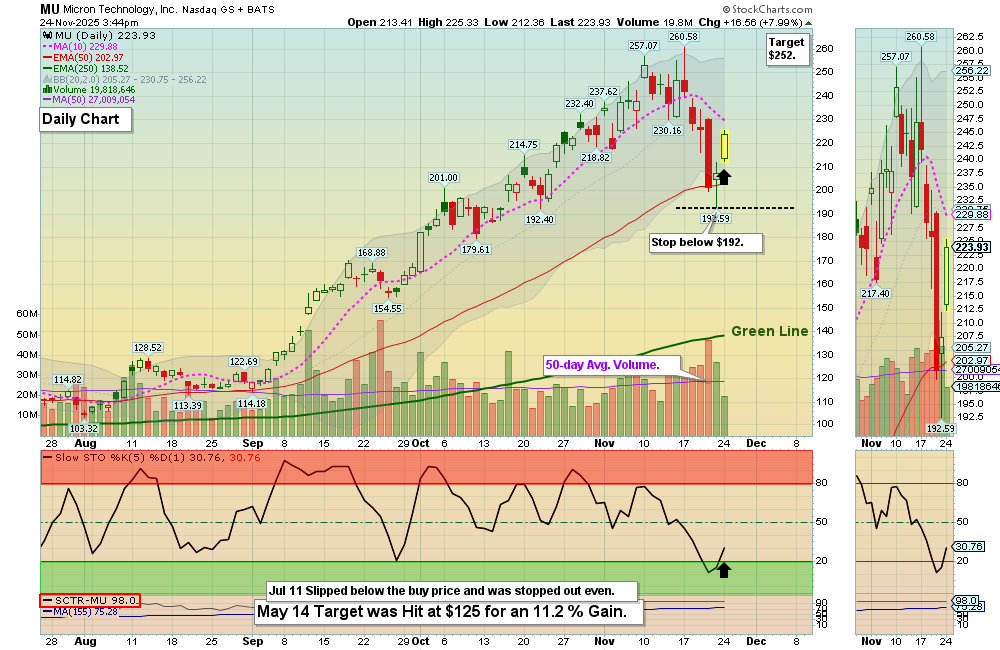
MU Micron Technology Inc Swing Trade Buy on the Close, but its already up 8% (2 Star Trade).
QS Quantumscape Corp Swing Trade Buy on the Close, but the volume is not high (2 Star Trade).
SNDK SanDisk Corp Swing Trade Buy on the Close, but its already up 12.5% (Caution).
BUYS SOON
| Open Date | Symbol | Description | SCTR | Last Price | Daily Change % | Comments | ATGL 60 Min | id | Strategy | Position | Sell Date | Sell Price | Purchase Price | Net Profit | Realized Gain/Loss % | ATGL Rule | Industry | Size | Stop Loss | color | Chart | Update Date | Status | Unrealized Gain/Loss % | Volume | Post Type | # Shares | Amount Invested | Portfolio Weight | Dividend Rate | Current Yield | Current Value | Yield on Cost | Projected Annual Dividends | Total Dividends Received | Pay Back | Profit / Loss | Annualized Profit/Loss | Star Rating | Target Price | News Alert % | Target Triggered |
|---|---|---|---|---|---|---|---|---|---|---|---|---|---|---|---|---|---|---|---|---|---|---|---|---|---|---|---|---|---|---|---|---|---|---|---|---|---|---|---|---|---|---|
| 2026-06-18 | APPS | Digital Turbine Inc. | 96 | $8.59 | -0.2323 | Wait for next Daily Money Wave Close > 20 with High Volume. | 5093 | Short Term | Long | $0.00 | 0.00% | Software | Small | https://stockcharts.com/sc3/ui/?s=APPS&a=2293191731&p=D&yr=0&mn=4&dy=0&id=p58001660323 | 2026-06-21 19:13:01 | open | 0.00% | 0 | Watch List | $0 | 0.00% | 0.00 | 0 | $0 | 0.00% | $0 | $0 | 0.00% | 0.00% | - | $10.00 | |||||||||||
| 2026-06-17 | RXO | RXO Inc. | 92 | $25.36 | -0.1182 | Wait for next Daily Money Wave Close > 20 with High Volume. | 5091 | Short Term | Long | $0.00 | 0.00% | Transport | Small | https://stockcharts.com/sc3/ui/?s=RXO&a=2292341458&p=D&yr=0&mn=4&dy=0&id=p19522285398 | 2026-06-17 19:11:32 | open | 0.00% | 0 | Watch List | $0 | 0.00% | 0.00 | 0 | $0 | 0.00% | $0 | $0 | 0.00% | 0.00% | - | $28.50 | |||||||||||
| 2026-06-16 | BAND | Bandwidth Inc. | 98 | $51.19 | -0.3892 | Wait for next Daily Money Wave Close > 20 with High Volume. | 5090 | Short Term | Long | $0.00 | 0.00% | Telecom | Small | https://stockcharts.com/sc3/ui/?s=BAND&a=2291301469&p=D&yr=0&mn=4&dy=0&id=p58001660323 | 2026-06-16 16:30:16 | open | 0.00% | 0 | Watch List | $0 | 0.00% | 0.00 | 0 | $0 | 0.00% | $0 | $0 | 0.00% | 0.00% | - | $67.50 | |||||||||||
| 2026-06-14 | RDW | Redwire Corp. | 94 | $14.18 | -1.2195 | Wait for next Daily Money Wave Close > 20 with High Volume. | 5087 | Short Term | Long | $0.00 | 0.00% | AeroSpace | Small | https://stockcharts.com/sc3/ui/?s=RDW&a=2281132577&p=D&yr=0&mn=4&dy=0&id=p21116263806 | 2026-06-14 19:16:51 | open | 0.00% | 0 | Watch List | $0 | 0.00% | 0.00 | 0 | $0 | 0.00% | $0 | $0 | 0.00% | 0.00% | - | $21.00 |
Shop for a better price earlier in the day with Green Candle Buy Signal, on the same day that a Daily Money Wave Buy Signal will occur.
Many like to Buy the Swing Trades just before the Close, if the Money Wave is going to create a Buy Signal (Closing > 20 and up out of the Green Zone). Don’t Buy if the Security has already popped up too much. Money Wave Buy Signals are usually good for a 3-6 % move in a few days.
SELLS TODAY
ARWR Arrowhead Pharmaceuticals Inc. Target was hit at $42, securing a 3.8% gain after a pop today.
________________________________________________________________________
WEEKLY SWING TRADE POPS
MP Mp Materials Corp. Weekly Swing Trade buy today. Target is $75.
WEEKLY SWING TRADING (Formerly LONG TERM)Watch List and Charts to Buy Soon.
| Weekly Swing Watch List to Buy | Weekly Swing Charts to Buy |
| Current Weekly Positions | Current Weekly Charts |
| Closed Weekly Swing Trades | Stage Chart Investing |
DAY TRADING SETUPS. Today we had 20 scalp trades for nice Gains at our Trading Room. In this Emotional Market now, Day Trading Alerts are not being sent out on our Discord Site with Live Chatting. Please install Discord app on your PC or cell for mobile notifications. Check out our Live Stream.
Or look for Green Candle Buy Pops (Red Candle turns Green). Big Movers today: ONDS +26% IREN+14% & SNDK+13%.
Bonds were up today and are Above the Green Line.
Crude Oil was up $0.85 today at $58.91.
MY TRADING DASHBOARD
SWING TRADING CURRENT POSITIONS
DAY TRADING SETUPS
TRADE ALERTS
STAGE CHART INVESTING
TOP 100 STOCKS
PREVIOUS GREEN LINE STOCKS