By ATGL
Updated August 25, 2025
Unusual market events can trigger dramatic price movements that create significant opportunities for prepared investors. A gamma squeeze stands out as one of the most powerful forces capable of driving stocks to extraordinary levels within compressed timeframes. This mechanism occurs when options-related hedging activities by market makers amplify buying pressure, creating a self-reinforcing cycle of price acceleration. Understanding the mechanics, identifying warning signs, and recognizing chart patterns can position you to capitalize on these rapid movements while managing associated risks.
What Is a Gamma Squeeze in the Stock Market?
A gamma squeeze represents a feedback loop where increasing call option activity forces market makers to purchase underlying shares to maintain delta-neutral positions. When traders buy large volumes of call options, market makers must hedge by purchasing the underlying stock. As stock prices rise, call option deltas increase, requiring additional share purchases to maintain hedges. This continuous buying pressure can accelerate price movements far beyond fundamental justifications.
The mechanism stems from options market dynamics rather than traditional supply and demand. Market makers use the Greeks, particularly delta and gamma, to calculate hedge requirements. Delta measures option price sensitivity to stock movement, while gamma measures delta’s rate of change. When gamma exposure becomes extreme, small price movements require substantial hedging adjustments, amplifying the original move.
How Long Does a Gamma Squeeze Last?
Gamma squeezes typically last from several hours to a few trading sessions, depending on options expiration dates and market conditions. The temporary nature occurs because options expire, reducing hedging obligations that fuel the squeeze. Once options expire or traders close positions, artificial buying pressure subsides, often leading to rapid corrections.
Short squeezes operate through different mechanics. Both phenomena drive dramatic price increases, but short squeezes result from heavily shorted stocks experiencing buying pressure that forces short covering. This creates additional demand, pushing prices higher and potentially triggering more covering.
The key distinction lies in participants and timeframes. Short squeezes can persist for weeks or months when fundamentals support higher valuations. Stock gamma squeeze events are inherently temporary, tied to specific options contracts and expiration cycles. Short squeezes require high short interest as fuel, while gamma squeezes need significant call option open interest concentrated at specific strikes.
What Indicators Reveal an Oncoming Gamma Squeeze?
Several metrics can signal developing gamma squeeze conditions. High call option volume represents the primary catalyst, particularly when concentrated at out-of-the-money strikes near current prices. Monitor daily options volume relative to historical averages and call-to-put ratios for unusual patterns.
Rising open interest in call options provides another crucial indicator. Open interest measures outstanding contracts, and dramatic increases suggest accumulating positions requiring hedging. Focus on strikes within 5% to 10% of current prices, as these options have the highest gamma exposure.
Unusual options flow patterns can reveal institutional positioning ahead of potential squeezes. Large block trades in short-dated options may indicate volatility positioning. Technical indicators for trading help identify momentum shifts coinciding with options activity.
Stock price acceleration often accompanies developing gamma conditions. Look for stocks breaking resistance on higher volume, particularly when coinciding with heavy options activity. Movements disproportionate to news may indicate options-driven buying.
Volatility expansion signals increasing uncertainty and potential gamma exposure. Rising implied volatility often precedes gamma events as option premiums increase. Monitor volatility percentiles to identify unusual expansion.
Spotting a Gamma Squeeze Using Charts
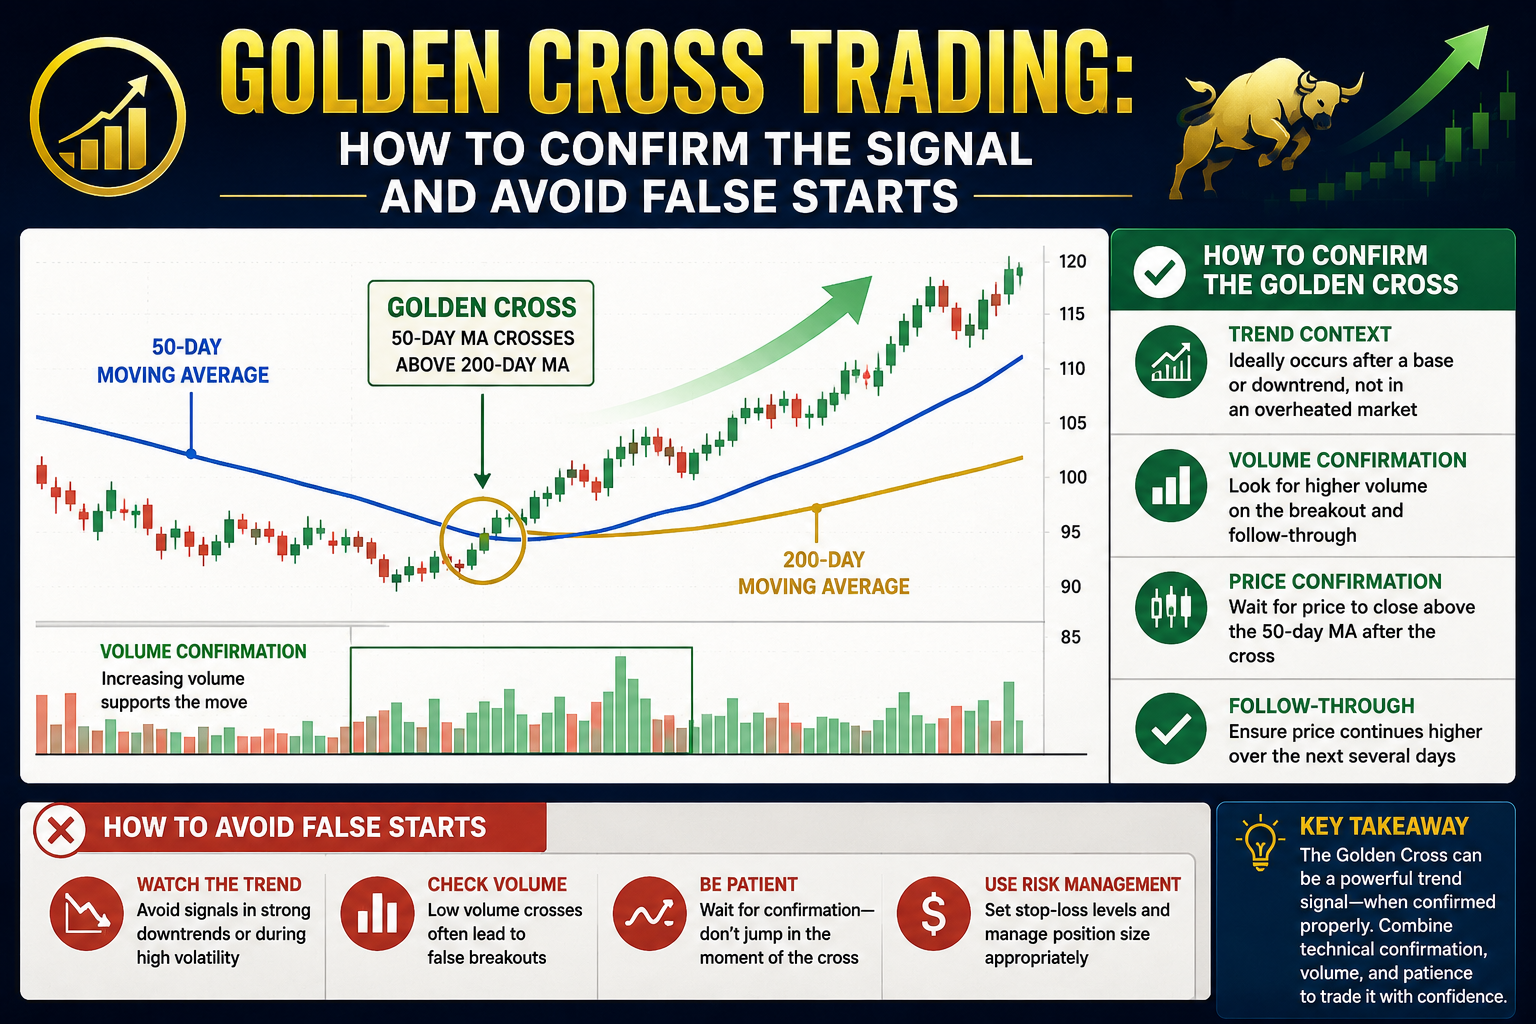
Chart analysis becomes critical for identifying gamma squeeze opportunities before full development. Begin by examining volume patterns, looking for sustained increases above the 50-day moving average. Volume spikes accompanying breakouts from consolidation patterns often coincide with gamma acceleration phases.
Price action analysis should focus on parabolic moves defying normal resistance levels. Gamma squeezes frequently produce nearly vertical charts as automated hedging overwhelms selling pressure. Look for stocks breaking multiple resistance levels in single sessions without significant pullbacks.
Options chain analysis provides direct insight into gamma potential. Examine open interest distribution across strikes, identifying concentrations at specific levels. High open interest at strikes slightly above current prices creates the highest exposure potential. Monitor these levels throughout trading days, as approaches to high-gamma strikes often trigger acceleration.
Volume-weighted average price (VWAP) can help identify when gamma buying overwhelms normal patterns. Stocks trading consistently above VWAP with expanding volume may indicate institutional or market maker buying supporting a developing squeeze.
Real-World Gamma Squeeze Examples
GameStop’s January 2021 gamma squeeze remains the most documented example. Heavy call option buying in weekly contracts created massive gamma exposure as the stock approached key strikes. Market makers were forced to purchase millions of shares for hedging, driving prices from approximately $40 to over $400 in days.
Tesla experienced multiple gamma squeeze events throughout 2020, particularly around earnings and stock split dates. Retail call buying and institutional options strategies created repeated gamma exposure situations, contributing to dramatic price appreciation.
AMC witnessed similar dynamics during its 2021 surge, where heavy retail call buying concentrated at specific strikes created self-reinforcing spirals. The stock moved from single digits to over $70 as market makers adjusted hedges.
These examples demonstrate common characteristics: heavy retail call participation, open interest concentration at specific strikes, and price movements far exceeding fundamental justifications during squeeze periods.
Risks and Limitations of Trading a Gamma Squeeze
Gamma squeeze trading carries substantial risks that can quickly eliminate profits or create significant losses. The primary danger lies in timing, as these events can reverse as rapidly as they develop. Once options expire or close, artificial buying pressure disappears, often triggering sharp corrections.
Volatility represents another major risk. Forces driving parabolic increases can work in reverse, creating equally dramatic downward moves. Traders entering late in the squeeze cycle face the highest reversal risk.
Liquidity can deteriorate during extreme gamma events, making entries and exits more difficult. Bid-ask spreads often widen during volatile periods, increasing transaction costs. Market makers have sophisticated tools to manage gamma exposure, potentially limiting squeeze duration and magnitude.
Act on Market Moves With Confidence
Gamma squeezes represent powerful market phenomena that can create substantial trading opportunities for prepared investors. Understanding the mechanics, recognizing warning signs through options flow analysis, and identifying chart patterns can position traders to capitalize on rapid price movements. However, the temporary nature and inherent volatility demand careful risk management and precise timing.
Success requires combining technical analysis, options market knowledge, and disciplined risk management. Identifying developing conditions before they reach extremes provides the greatest advantage.
To develop advanced skills in recognizing and trading complex market phenomena like gamma squeezes, consider exploring Above the Green Line’s comprehensive trading education and analysis tools. Professional guidance can help you navigate volatile market conditions while managing risk appropriately.

Related Articles
[pt_view id=”9517038dwu”]