By ATGL
Updated August 22, 2025
Technical analysis remains central to the decision-making process for active traders and investors. Chart patterns provide structure when markets appear uncertain, helping identify areas where reversals are likely. Among these setups, the Quasimodo pattern is gaining recognition as a reliable reversal signal that can guide swing traders, day traders, and financial advisors toward higher-probability entry points.
This article will explain how the Quasimodo pattern forms, outline its bullish and bearish applications, review confirmations such as Fibonacci and supply-demand zones, provide rules for entries and stop placement, and compare the setup with more familiar reversal formations like the head and shoulders pattern and double top pattern. By the end, you will understand how to integrate the Quasimodo into a systematic trading plan.
How the Quasimodo Pattern Shapes Market Reversals
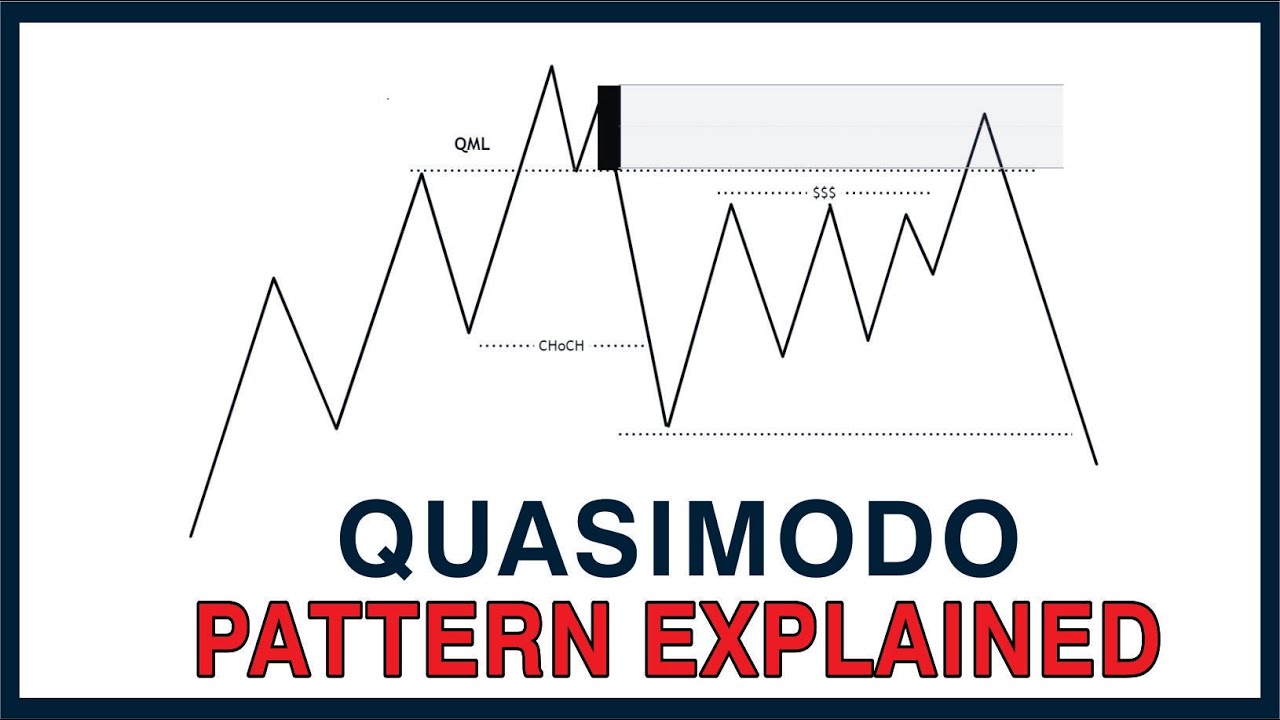
The Quasimodo pattern is a reversal formation characterized by a sequence of higher highs and lower lows in an uptrend, or lower lows and higher highs in a downtrend. It reflects exhaustion in the prevailing move and offers structure for identifying when momentum shifts.
What Is the Quasimodo Pattern?
It is a price formation where the market creates an extended high (or low) relative to prior structure, but then fails to sustain continuation. The subsequent retracement into support or resistance levels often provides a precise entry area for traders. Unlike some patterns that rely heavily on symmetry, the Quasimodo is defined by its irregular but structured sequence of peaks and troughs.
For swing traders, it highlights potential reversals on 4-hour or daily charts where trend shifts matter most. For day traders, the same structure can be applied on shorter intraday timeframes for tactical entries.
Identifying the Bullish Quasimodo Pattern
A bullish Quasimodo develops after a downtrend begins to weaken. Its sequence typically includes:
- A lower low relative to previous swing points.
- A higher high breaking the prior lower high.
- A retracement forming a new low that undercuts the initial swing but fails to extend downside momentum.
- Price rallies from that low into a reversal, confirming a bullish structure.
Key confirmation areas include horizontal support zones and retracement levels measured by Fibonacci confirmation. Traders often look for entries when price revisits these zones, with volume and oscillator divergence strengthening the case.
How To Recognize the Bearish Quasimodo Pattern?
The bearish variation appears after an uptrend loses strength. Its structure consists of:
- A higher high beyond the previous swing.
- A pullback forming a higher low.
- A subsequent push that fails to sustain new highs.
- A reversal back through prior support, establishing lower low momentum.
Confirmation typically comes from horizontal resistance or declining trendlines. Traders monitor supply zones for entries, seeking to position as sellers when bullish momentum fails.
Analyzing the Quasimodo Chart Pattern for Trading Decisions
Spotting the pattern is only the first step. Structuring entries, stop placement, and risk evaluation support consistent execution.
How Accurate Is the Quasimodo Pattern?
Its accuracy depends on context. Alone, it can mislead in volatile markets, but when paired with supporting indicators such as Fibonacci retracements, moving averages, or volume shifts, it becomes significantly more reliable. Historical testing shows that patterns aligning with multi-timeframe support and resistance deliver stronger results than isolated signals.
Rules for evaluation include:
- Entry: Traders often place limit orders at key retracement or support/resistance levels once the Quasimodo structure is validated.
- Stop Placement: Stops are best set beyond the extreme of the invalidation point, typically slightly below the low in bullish setups or above the high in bearish setups.
- Risk-to-Reward: A minimum of 1:2 is common, ensuring that profits outweigh potential losses.
Comparing Quasimodo With Similar Patterns
The Quasimodo often draws comparisons to the head and shoulders pattern since both highlight trend reversals. However, the Quasimodo doesn’t require symmetry, which allows it to appear more frequently. Unlike the double top pattern, it accounts for a structural break in trend direction rather than a simple retest of resistance or support. This flexibility makes it particularly useful for traders seeking earlier entry signals.
Applying the Quasimodo Forex Pattern in Currency Markets
The Quasimodo structure is especially effective in forex, where liquidity and volatility produce clear swing points.
What Are the Best Timeframes for the Quasimodo Pattern?
For swing traders, four-hour and daily charts provide cleaner patterns with less noise. Day traders often use 15-minute or one-hour charts to capture intraday reversals. Scalpers can apply the pattern to lower timeframes, though risk management becomes increasingly critical.
The bullish Quasimodo in forex often appears when a currency pair exhausts during a strong downtrend, while the bearish version surfaces at the top of extended rallies. Traders look for confirmation at supply-demand zones, with added weight when the setup aligns with macroeconomic releases or central bank decisions.
Rules for Entry, Stop Placement, and Risk Management
A consistent framework is essential when applying the Quasimodo pattern. Traders often misinterpret the setup by entering too early, which reduces its reliability. Clear entry rules, combined with protective stops and risk controls, create a systematic process.
Entry Rules
- Wait for full structure confirmation: The pattern is valid only once all four structural points have formed and price has retraced into the reversal zone. Entering earlier increases the likelihood of false signals.
- Use zone-based entries: Mark the support zone in bullish setups or the resistance zone in bearish setups and place limit orders there instead of entering at market. This allows for precise positioning.
- Confirm with secondary tools: Add reliability by using Fibonacci retracements, supply and demand zones, or oscillator divergence to validate the reversal zone.
Stop Placement
- Set stops beyond invalidation: Place stops slightly beyond the most recent swing low in bullish setups or swing high in bearish setups, not directly on the structural level.
- Account for volatility: Use a measure such as Average True Range (ATR) to avoid stops that are too tight and vulnerable to normal price fluctuations.
- Choose conservative or aggressive placement consciously: Tighter stops reduce per-trade risk but increase the chance of premature exit, while wider stops lower the odds of being stopped out but require smaller position sizing.
Risk Management
- Limit risk per trade: Many traders risk no more than 1% to 2% of account equity on a single position.
- Maintain a favorable reward ratio: Target a minimum of 1 to 2 risk-to-reward, so gains outweigh losses over time.
- Scale and trail effectively: Consider partial exits at key levels while trailing stops on the remainder to secure profits and allow room for extended moves.
Enhance Your Trading With Systematic Pattern Recognition
The Quasimodo pattern offers a precise, rules-based framework for spotting reversals. Its structure of higher highs and lower lows, combined with confirmation tools like Fibonacci levels and supply-demand zones, provides actionable entry points for traders across markets. Compared to traditional reversal patterns, its irregular structure makes it more adaptable while still maintaining reliability.
For traders seeking a structured way to refine technical analysis, the systematic application of the Quasimodo can add discipline to their trading plan. With an Above the Green Line membership, you gain direct access to our signals, annotated charts, and trading models that keep your decisions focused and disciplined.

Related Articles
[pt_view id=”9517038dwu”]