By ATGL
Updated June 5, 2025
Sudden price increases create unique patterns on trading charts that investors need to notice quickly. These quick movements, known as spike chart patterns, can signal important chances or warnings that require fast action.
This guide looks at spike chart patterns, how they form, strategies for trading them, and real examples of how they work in the market. By understanding these strong price movements, you can create systematic ways to profit from unpredictable market behavior.
Recognizing the Spike Chart Pattern in Trading
A spike chart pattern appears as a sudden, vertical price movement that creates a sharp protrusion on price charts. It occurs when buying or selling pressure surges dramatically over a short period, pushing prices well beyond their recent range, resembling a spike from normal price action.
Spike patterns differ from gradual price trends in their velocity and magnitude. While normal price movements develop progressively, spikes emerge rapidly, often within minutes or hours. These formations frequently appear on various types of stock charts, with each chart type revealing different aspects of the spike’s characteristics.
To tell the difference between genuine price spikes and normal market changes, look for a few key signs. Real spikes show extreme price movement that goes well beyond average trading ranges, usually moving three to five times more than a typical daily range. High trading volume is also important for confirming these spikes — true price spikes come with unusually high trading volume that proves the price change is real.
Normal volatility creates jagged price movements within established ranges, while spike patterns break these boundaries. Examining candlestick charts reveals additional clues: Spike formations often produce long wicks or tails that indicate rejection at extreme price levels. The speed of price movement provides another differentiator—spikes develop and reverse much faster than typical volatility patterns.
Typical Market Conditions Leading to Spikes
Several market conditions commonly produce spike formations. Unexpected news releases trigger immediate repricing as traders rush to adjust positions based on new information. Earnings announcements, regulatory decisions, and geopolitical events frequently generate these sudden movements. Low liquidity environments amplify price movements, allowing relatively small order flows to create dramatic price swings.
Interpreting Spike Patterns: What They Signal About Market Momentum
Spike patterns convey critical information about underlying market dynamics and participant behavior. These formations reveal moments when supply and demand equilibrium breaks down dramatically, forcing rapid price discovery.
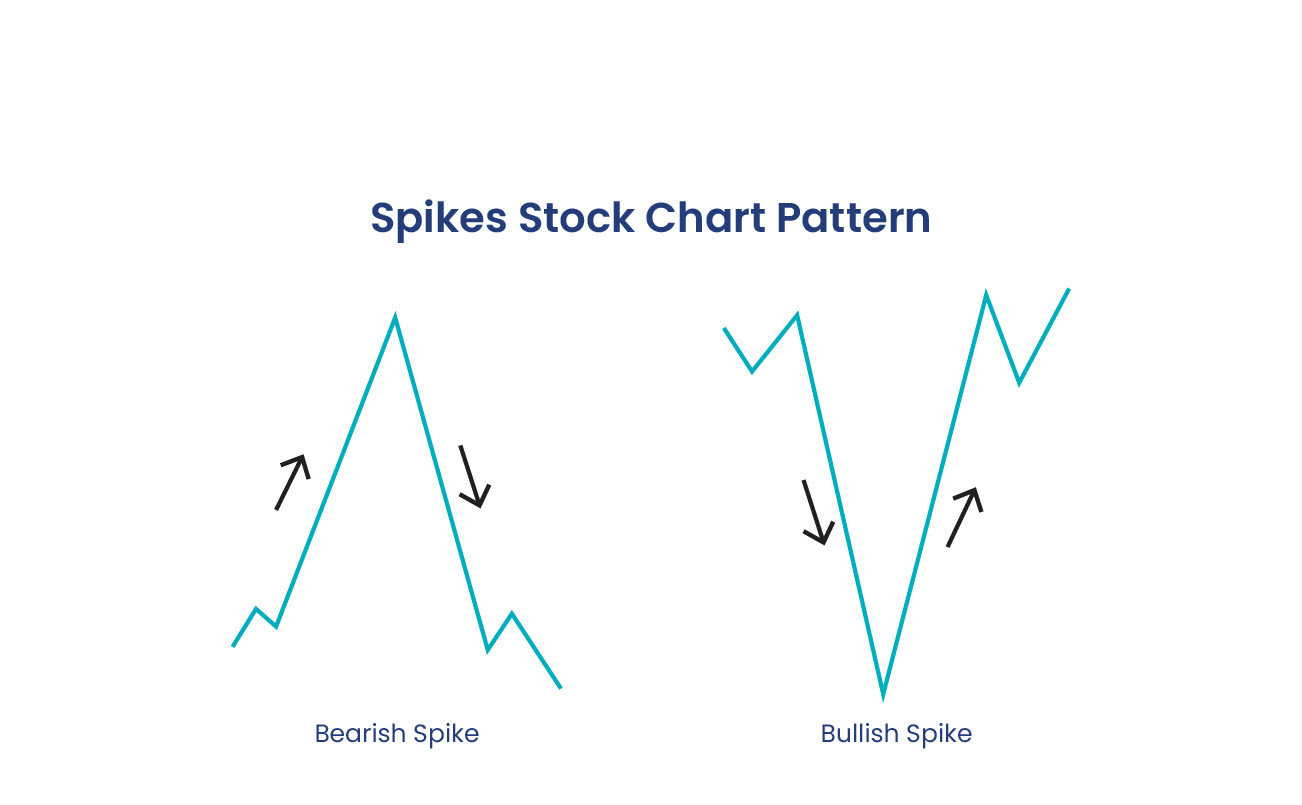
Bullish vs. Bearish Spike Patterns
Bullish spike patterns arise from sudden buying pressure that drives prices sharply upward, indicating strong accumulation by institutional buyers or short covering. These patterns feature rapid price increases followed by consolidation or partial retracement, especially after downtrends, which may signal trend reversals.
Conversely, bearish spike patterns occur due to intense selling pressure, which leads to sharp price declines and suggests distribution by large holders or panic selling. They often mark intermediate tops or accelerate downtrends, with their significance determined by their position within the broader trend context.
Spike Tops and Spike Bottoms: Reversal or Continuation?
Spike tops form when prices surge to new highs before reversing sharply, leaving long upper wicks on candlestick formations. These patterns often mark significant resistance levels where selling pressure overwhelms buying interest. Still, not all spike tops lead to reversals. Some represent brief pauses before trends resume.
Spike bottoms develop through capitulation selling that exhausts downward momentum. These V-shaped formations can mark major support levels where value buyers emerge. The reliability of spike bottoms improves when accompanied by positive divergences in momentum indicators. A strong reversal after a sharp drop usually needs either several attempts to go lower that fail, or quick buying afterward, to prove the trend is really turning around.
Key Indicators To Confirm Spike Chart Patterns
The most reliable spike patterns exhibit confluence across several technical measures. Understanding which indicators provide the strongest confirmation helps you filter out noise and focus on actionable patterns.
Monitoring economic calendar events can help you identify scheduled catalysts likely to generate volatility. Options flow data can reveal unusual positioning that may precede spike movements. Analyzing order book depth highlights potential liquidity gaps where spikes could develop.
Technical indicators in trading provide additional predictive value. Bollinger Band compressions often precede explosive moves that create spikes. Average True Range (ATR) readings below historical norms suggest coiled volatility ready to expand. Relative Strength Index (RSI) extreme readings combined with volume divergences frequently precede spike reversals.
Volume confirmation is another important tool for validating spike patterns. Genuine spikes occur with volume increases that are much higher than recent averages. Analyzing volume helps to tell whether a price move is likely to last or if it is just a brief event caused by liquidity changes. Using a combination of indicators can lower the chances of false signals and lead to better trading results.
Common Pitfalls and How To Avoid Them When Trading Spikes
Fakeout spikes, especially low-volume ones, pose a risk to spike pattern traders by mimicking real spikes without sustained momentum. To avoid them, you should look for volume confirmation and wait for post-spike consolidation before entering trades.
Overextended moves can trap traders in poor positions, arising after prolonged trends when final buyers or sellers capitulate. Distinguishing these exhaustion spikes from continuation patterns requires analyzing the broader trend and momentum. Conservative traders prefer waiting for pullbacks after spikes instead of pursuing extended moves.
Trading spikes without considering the broader market context creates unnecessary risks. Individual stock spikes occurring counter to sector or market trends face increased failure probability. Successful spike trading incorporates multiple time frame analyses to understand larger patterns in trading.
How To Integrate Spike Chart Patterns Into a Winning Trading Strategy
Aggressive entry strategies leverage spike momentum by entering positions during the initial thrust, requiring precise timing and tight stop-losses. While this approach entails higher failure rates, it offers superior risk-reward ratios. Scaling into positions during spike development can mitigate timing risks.
Conversely, conservative entry methods wait for post-spike consolidation, sacrificing some profit potential for higher probability setups. Optimal entries occur during pullbacks to spike midpoints or breakout tests, allowing for clearer trend confirmation and defined risk.
Integrating tools like advance-decline lines and sector rotation analysis enhances spike trading effectiveness. A systematic approach that combines spike recognition with established trading frameworks helps produce consistent results, while regular performance reviews identify which variations yield the best returns for individual styles.
Elevate Your Trading With Proven Spike Pattern Techniques
Mastering spike chart pattern recognition turns reactive trading into a proactive strategy. These formations offer early warnings of significant price movements, allowing traders to position themselves advantageously. By combining pattern recognition with strong risk management and analysis tools, traders can effectively navigate volatile markets.
Success with spike patterns demands continuous learning and disciplined execution, as each market presents unique characteristics that require adaptive strategies. Traders who understand these nuances can consistently profit from market volatility. Ready to develop a comprehensive approach that incorporates spike patterns and other proven techniques? Explore our complete stock trading strategy to build a systematic framework for long-term trading success. Join Above the Green Line to learn more.

Related Articles
[pt_view id=”9517038dwu”]