Watch List and Charts to Buy Soon.
| Daily Swing Watch List to Buy | Daily Swing Charts to Buy |
| Current Daily Swing Positions | Current Swing Charts |
| Closed Daily Swing Results | Trading Dashboard |
Current Pick and Chart
| Top Pick of the Week | TPOW Stock Chart |
May 9, 2025 Markets were mixed today on very low Volume. The Indices are still over-bought for the short term, and were able to make slightly higher highs today. Story Stocks were popping as the FOMO (Fear of Missing Out) returns. Not many stocks in the Green Zones (over-bought).
Wait for more Buy Signals coming up out of the Green Zones. CHARTS The best moves happen when the S&P 500 Index is also coming up out of the Green Zone.
______________________________________________________________________________
BUYS TODAY 5/09/2025
GH GUARDANT HEALTH Swing Trade Buy on the Close today, but the Volume was not high (2 Star trade).
BUYS SOON
| Open Date | Symbol | Description | Industry | SCTR | Size | Last Price | Daily Change % | ATGL 60 Min | Comments | id | Strategy | Position | Sell Date | Sell Price | Purchase Price | Net Profit | Realized Gain/Loss % | ATGL Rule | Stop Loss | color | Chart | Update Date | Status | Unrealized Gain/Loss % | Volume | Post Type | # Shares | Amount Invested | Portfolio Weight | Dividend Rate | Current Yield | Current Value | Yield on Cost | Projected Annual Dividends | Total Dividends Received | Pay Back | Profit / Loss | Annualized Profit/Loss | Star Rating | Target Price | News Alert % | Target Triggered |
|---|---|---|---|---|---|---|---|---|---|---|---|---|---|---|---|---|---|---|---|---|---|---|---|---|---|---|---|---|---|---|---|---|---|---|---|---|---|---|---|---|---|---|
| 2026-06-17 | RXO | RXO Inc. | Transport | 92 | Small | $25.82 | 1.6936 | Wait for next Daily Money Wave Close > 20 with High Volume. | 5091 | Short Term | Long | $0.00 | 0.00% | https://stockcharts.com/sc3/ui/?s=RXO&a=2292341458&p=D&yr=0&mn=4&dy=0&id=p19522285398 | 2026-06-17 19:11:32 | open | 0.00% | 1 | Watch List | $0 | 0.00% | 0.00 | 0 | $0 | 0.00% | $0 | $0 | 0.00% | 0.00% | - | $28.50 | |||||||||||
| 2026-06-16 | BAND | Bandwidth Inc. | Telecom | 98 | Small | $50.82 | -1.1092 | Wait for next Daily Money Wave Close > 20 with High Volume. | 5090 | Short Term | Long | $0.00 | 0.00% | https://stockcharts.com/sc3/ui/?s=BAND&a=2291301469&p=D&yr=0&mn=4&dy=0&id=p58001660323 | 2026-06-16 16:30:16 | open | 0.00% | 1153 | Watch List | $0 | 0.00% | 0.00 | 0 | $0 | 0.00% | $0 | $0 | 0.00% | 0.00% | - | $67.50 | |||||||||||
| 2026-06-14 | RDW | Redwire Corp. | AeroSpace | 94 | Small | $13.02 | -9.2683 | Wait for next Daily Money Wave Close > 20 with High Volume. | 5087 | Short Term | Long | $0.00 | 0.00% | https://stockcharts.com/sc3/ui/?s=RDW&a=2281132577&p=D&yr=0&mn=4&dy=0&id=p21116263806 | 2026-06-14 19:16:51 | open | 0.00% | 1421214 | Watch List | $0 | 0.00% | 0.00 | 0 | $0 | 0.00% | $0 | $0 | 0.00% | 0.00% | - | $21.00 |
Shop for a better price earlier in the day with Green Candle Buy Signal, on the same day that a Daily Money Wave Buy Signal will occur.
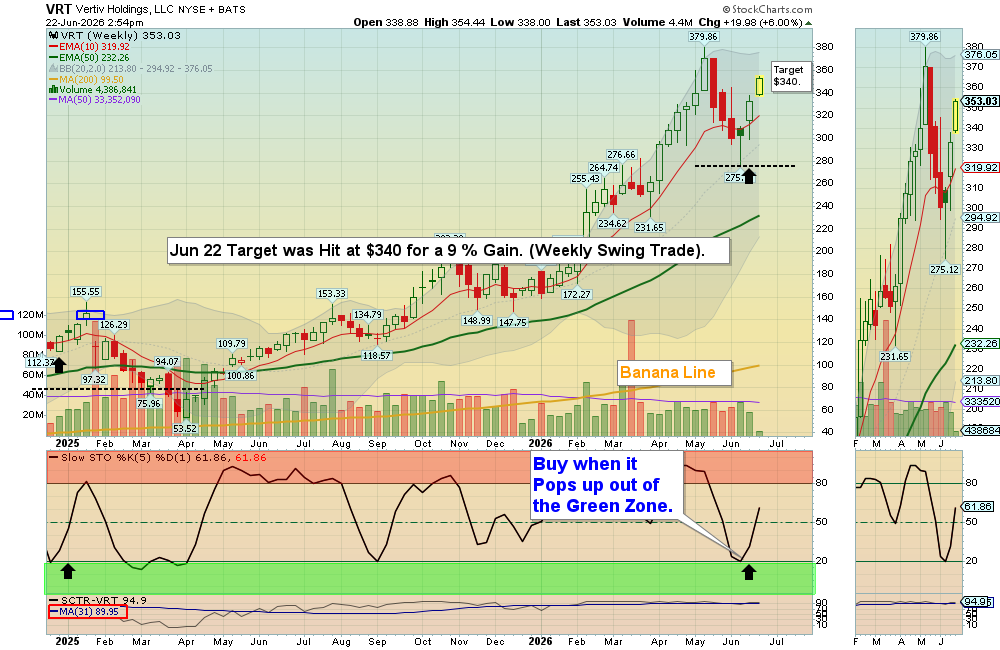
Many like to Buy the Swing Trades just before the Close, if the Money Wave is going to create a Buy Signal (Closing > 20 and up out of the Green Zone). Don’t Buy if the Security has already popped up too much. Money Wave Buy Signals are usually good for a 3-6 % move in a few days.
SELLS TODAY
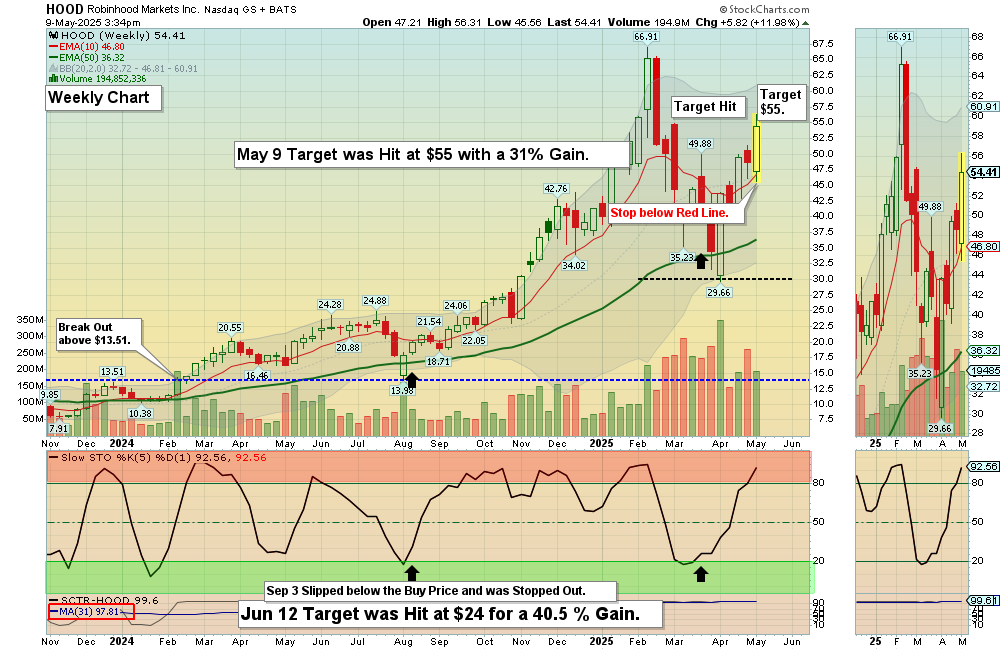
HOOD ROBINHOOD MKTS Target was Hit at $55 with a 31% Gain (Long Term Portfolio).
_____________________________________________________________________________
DAY TRADING SETUPS. Today we had 14 scalp trades for nice Gains at our Trading Room. In this Emotional Market now, Day Trading Alerts are not being sent out on our Discord Site with Live Chatting. Please install Discord app on your PC or cell for mobile notifications. Check out our Live Stream.
Or look for Green Candle Buy Pops (Red Candle turns Green). Big Movers today: HTZ +8% GDXU +10% & TSLL +14%
Bonds were up today and are Below the Green Line.
Crude Oil was up $1.05 today at $60.95.
MY TRADING DASHBOARD
SWING TRADING CURRENT POSITIONS
DAY TRADING SETUPS
TRADE ALERTS
STAGE CHART INVESTING
GREEN LINE CHARTS AT STOCKCHARTS
ARE YOUR INVESTMENTS ABOVE THE GREEN LINE?
GREEN LINE RULES
ETF SECTOR ROTATION SYSTEM
Updated TOP 100 LIST Updated May 1, 2024
HAVE A NICE WEEKEND!