DAILY SWING TRADING (SHORT TERM)
Watch List and Charts to Buy Soon.
Daily Swing Watch List to Buy Daily Swing Charts to Buy
Current Daily Swing Positions Current Swing Charts
Closed Daily Swing Results Trading Dashboard
TOP PICK OF THE WEEK (TPOW)
Current Pick and Chart
Top Pick of the Week TPOW Stock Chart
The TOP PICK of the WEEK: Sofi Tech. $SOFI was bought on the Open today and will be Sold on the Close Friday.
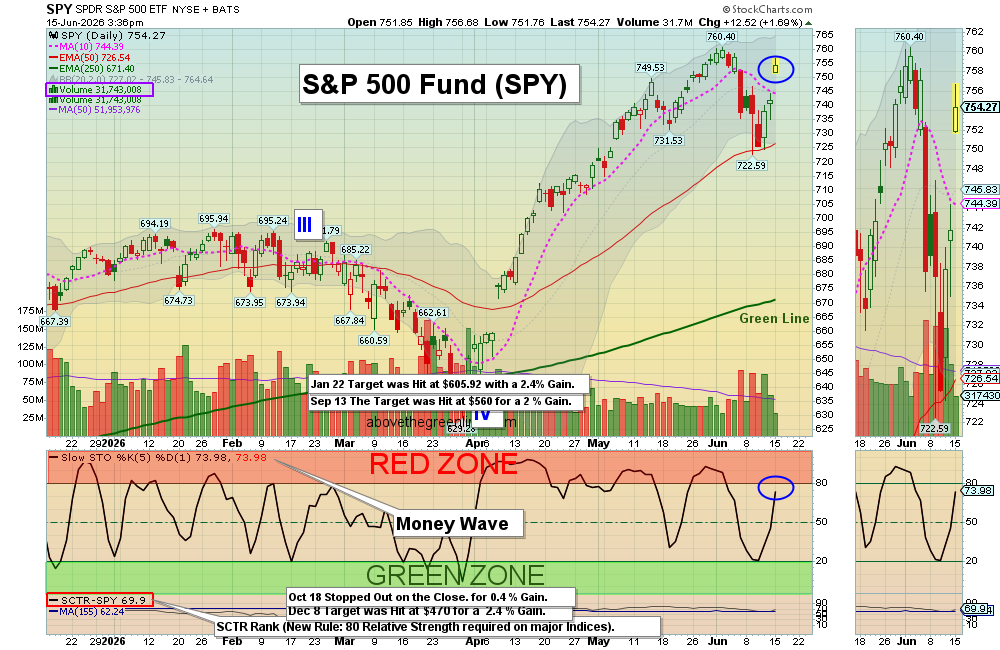
1/31/2025 The Markets were sharply lower on the opening, but recovered on the Close. Many were worried about Tariffs with other countries slowing down our Economy. We are waiting for more Leaders to return to the Green Zones for more Money Wave Buy Signals. The S&P 500 has struggled at the Resistance of last week’s High.
Bonds might need to go down once more. Most of the Stock Leaders were back up in the Red Zones (probably too late to Buy for the short term).
Wait for more Buy Signals coming up out of the Green Zones. CHARTS The best moves happen when the S&P 500 Index is also coming up out of the Green Zone. ______________________________________________________________________________
BUYS TODAY 2/3/2025
KULR KULR TECH Swing Trade Buy today for a bounce back up.
BUYS SOON
| Open Date | Symbol | Description | Industry | SCTR | Size | Last Price | Daily Change % | Comments | ATGL 60 Min | id | Strategy | Position | Sell Date | Sell Price | Purchase Price | Net Profit | Realized Gain/Loss % | ATGL Rule | Stop Loss | color | Chart | Update Date | Status | Unrealized Gain/Loss % | Volume | Post Type | # Shares | Amount Invested | Portfolio Weight | Dividend Rate | Current Yield | Current Value | Yield on Cost | Projected Annual Dividends | Total Dividends Received | Pay Back | Profit / Loss | Annualized Profit/Loss | Star Rating | Target Price | News Alert % | Target Triggered |
|---|---|---|---|---|---|---|---|---|---|---|---|---|---|---|---|---|---|---|---|---|---|---|---|---|---|---|---|---|---|---|---|---|---|---|---|---|---|---|---|---|---|---|
| 2026-06-17 | RXO | RXO Inc. | Transport | 92 | Small | $25.54 | 2.9009 | Wait for next Daily Money Wave Close > 20 with High Volume. | 5091 | Short Term | Long | $0.00 | 0.00% | https://stockcharts.com/sc3/ui/?s=RXO&a=2292341458&p=D&yr=0&mn=4&dy=0&id=p19522285398 | 2026-06-17 19:11:32 | open | 0.00% | 446133 | Watch List | $0 | 0.00% | 0.00 | 0 | $0 | 0.00% | $0 | $0 | 0.00% | 0.00% | - | $28.50 | |||||||||||
| 2026-06-16 | BAND | Bandwidth Inc. | Telecom | 98 | Small | $49.77 | -2.1046 | Wait for next Daily Money Wave Close > 20 with High Volume. | 5090 | Short Term | Long | $0.00 | 0.00% | https://stockcharts.com/sc3/ui/?s=BAND&a=2291301469&p=D&yr=0&mn=4&dy=0&id=p58001660323 | 2026-06-16 16:30:16 | open | 0.00% | 702853 | Watch List | $0 | 0.00% | 0.00 | 0 | $0 | 0.00% | $0 | $0 | 0.00% | 0.00% | - | $67.50 | |||||||||||
| 2026-06-14 | RDW | Redwire Corp. | AeroSpace | 94 | Small | $13.82 | -3.7953 | Wait for next Daily Money Wave Close > 20 with High Volume. | 5087 | Short Term | Long | $0.00 | 0.00% | https://stockcharts.com/sc3/ui/?s=RDW&a=2281132577&p=D&yr=0&mn=4&dy=0&id=p21116263806 | 2026-06-14 19:16:51 | open | 0.00% | 14867385 | Watch List | $0 | 0.00% | 0.00 | 0 | $0 | 0.00% | $0 | $0 | 0.00% | 0.00% | - | $21.00 |
Shop for a better price earlier in the day with Green Candle Buy Signal, on the same day that a Daily Money Wave Buy Signal will occur.
Many like to Buy the Swing Trades just before the Close, if the Money Wave is going to create a Buy Signal (Closing > 20 and up out of the Green Zone). Don’t Buy if the Security has already popped up too much. Money Wave Buy Signals are usually good for a 3-6 % move in a few days.
SELLS TODAY
ACHR ARCHER AVIATION Slipped down to the Buy Price and was Stopped Out even.
RCAT RED CAT HOLDINGS Slipped down to the Buy Price and was Stopped Out even.
XLY CONSUMER FUND Slipped below the Pink Line and was Stopped Out. The Target was already Hit at $235 with a 3.6% Gain.
_____________________________________________________________________________
DAY TRADING SETUPS. Today we had 16 scalp trades for $3,704 at our Trading Room. In this Emotional Market now, Day Trading Alerts are not being sent out on our Discord Site with Live Chatting. Please install Discord app on your PC or cell for mobile notifications. Check out our Live Stream.
Or look for Green Candle Buy Pops (Red Candle turns Green). Big Movers today: GDS + 18 % OKLO + 13 % & TSLQ + 12 %.
Bonds were up today and are Below the Green Line.
Crude Oil was up $0.38 today at $72.88.
MY TRADING DASHBOARD
SWING TRADING CURRENT POSITIONS
DAY TRADING SETUPS
TRADE ALERTS
STAGE CHART INVESTING
GREEN LINE CHARTS AT STOCKCHARTS
ARE YOUR INVESTMENTS ABOVE THE GREEN LINE?
GREEN LINE RULES
ETF SECTOR ROTATION SYSTEM
Updated TOP 100 LIST Updated Jan 1, 2024
Important Links
Top 100 Stage Chart Investing CNN Fear & Greed Index
Dividend Growth Portfolio ETF Sector Portfolio Dogs of the Dow
Long Term Strategy Stage Chart Investing Articles
* Safer Trades that meet ALL three criteria will be classified as 3 STAR, while trades that only meet two of the three criteria will be flagged as 2 STAR (more risk).