Tesla dropped 75 % after Parabolic Curve in 2021.
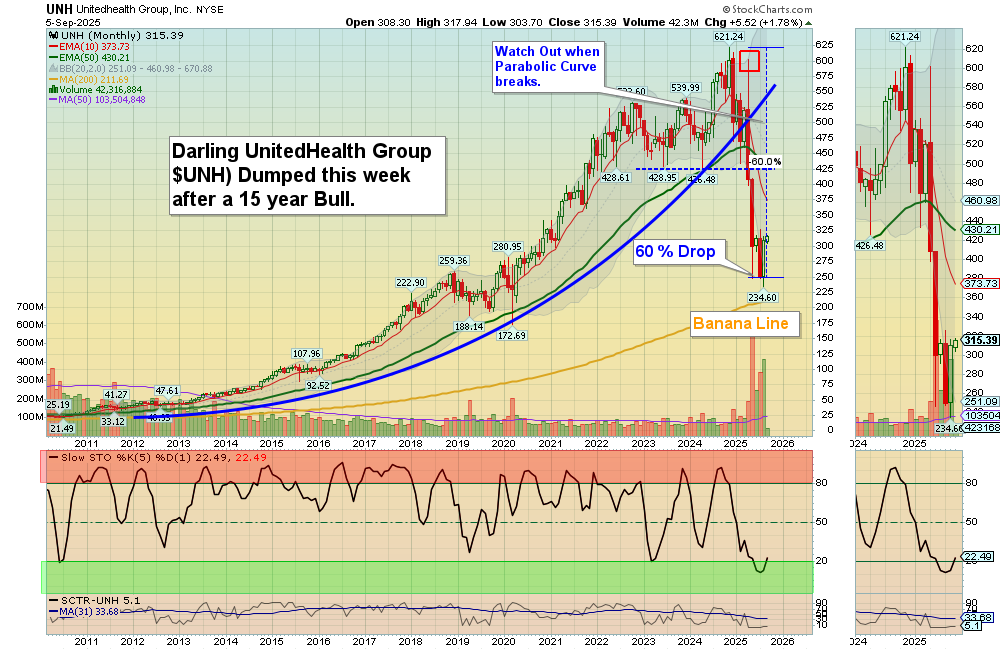
Darling United Healthcare broke the Parabolic curve, then had a Big 60 % Drop.
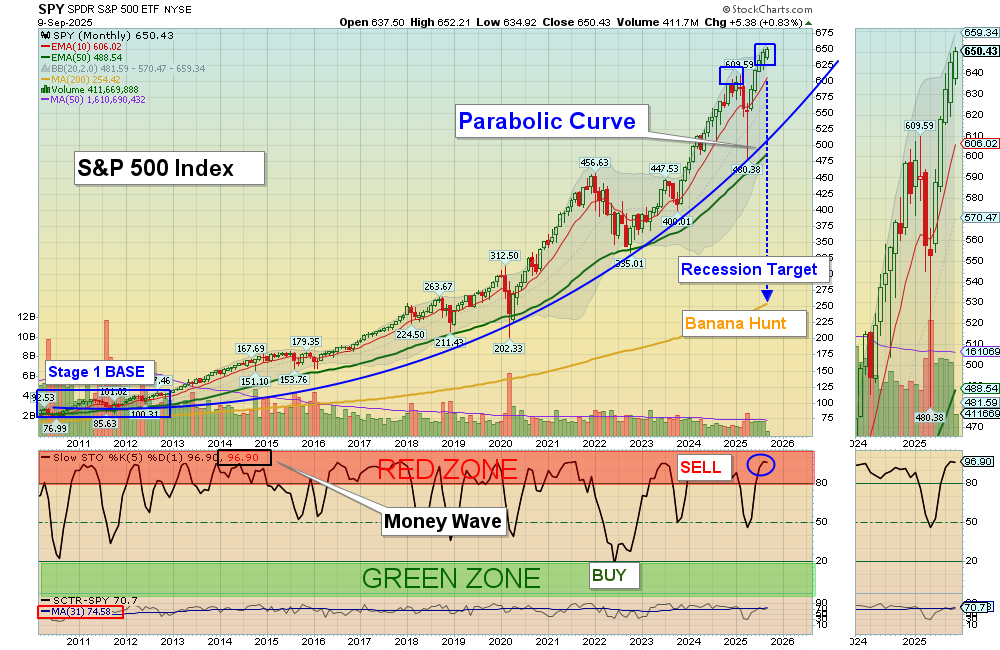
The S&P 500 Index is now Parabolic after a 16 year Historic Bull Mkt.
How to Trade a Parabolic Curve?
By: Market Moves Matt
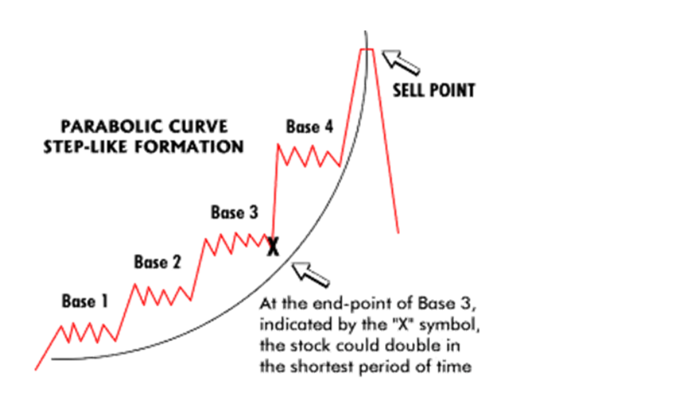
Here are three parts of the Parabolic move:
-
The Slow Advancement:
It is the easiest part to start comprehending the cycle. Here the stock is in a solid uptrend. There will generally be many bearish sentiments as a small-cap company is about to make a significant run-up. However, short sellers get trapped as it pulls back, gets back, and then goes higher.
-
The Panic Buying Climax:
Here begins the game of fear of missing opportunity. All the traders get tired of missing out on opportunities.
They begin chasing, and early shorts get liquidated by their brokers. Here the smart investor or traders begin to sell out their positions.
-
The Crash:
It is the third part of parabolic stock trading. The stock has reached its maximum peak. This is the point where short sellers focus on their payday. It is a ritual of parabolic stocks to take the stairs to go up while showing the decline with the elevator’s speed.
For instance, a stock named GME lost almost 80% of its value in one day after reaching maximum reach. As a short seller, this is a setup where you would be too late or too early. However, this kind of trading is not suggested for beginners willing to invest a big amount for trading.
In his lifetime, Warren Buffet got wealthy Buying Stocks at 100 % of GDP. But in 2025, Stocks are more than 200 % of GDP. Are you smarter than Buffett, who is Raising Cash?