By ATGL
Updated April 21, 2024
When assessing the potential for long-term investment in the technology sector, two prominent exchange-traded funds (ETFs) often come to mind: the Vanguard Information Technology ETF (VGT) and the Technology Select Sector SPDR Fund (XLK). Each offers unique exposure to the tech industry, yet they differ in their structure, holdings, and investment strategy. Choosing between VGT and XLK depends on an investor’s financial goals and risk tolerance. This article will dissect the key aspects of these ETFs to help investors determine which fund might better suit their long-term investment strategies.
Understanding Passively Managed Funds
Passively managed funds are investment funds that aim to replicate the performance of a specific benchmark index rather than attempting to outperform it. Their primary goal is to mirror the composition and returns of a particular index, such as the S&P 500 or the Nasdaq-100. This is typically achieved by holding all or a representative sample of the securities in the index in the same proportions as they appear in the index.
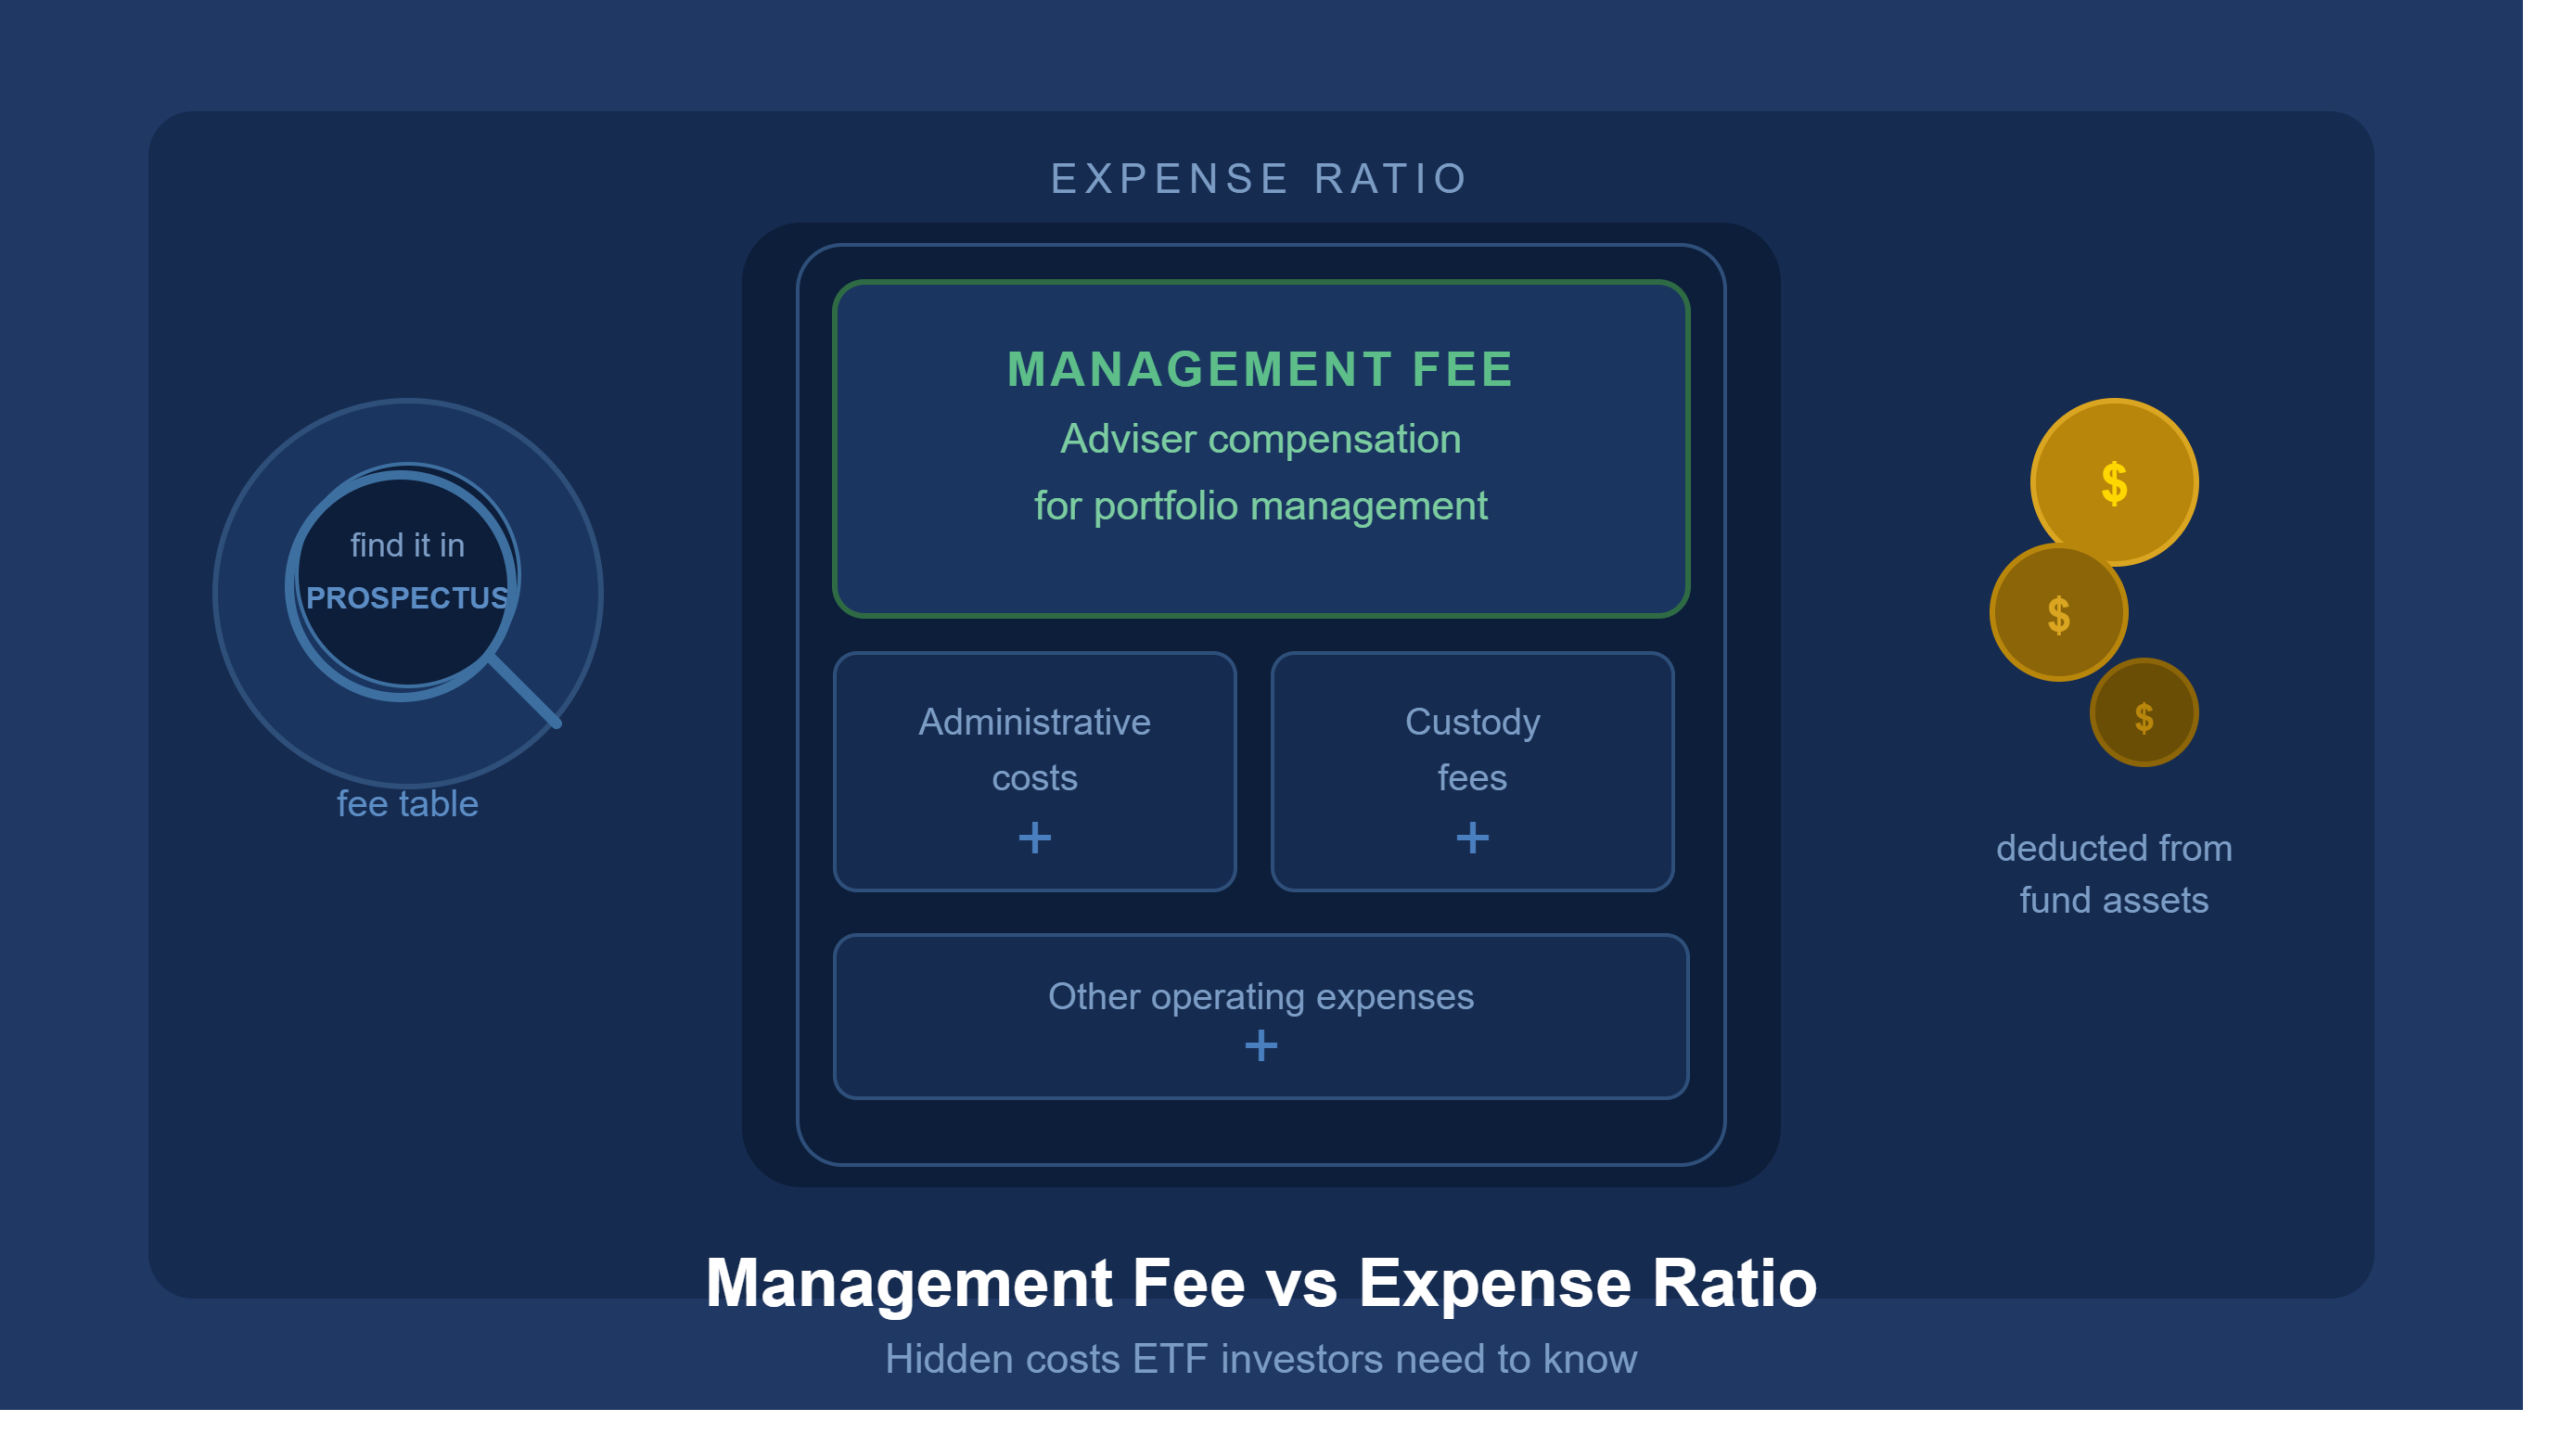
The advantages of passively managed funds include lower management fees and expense ratios, as they do not require active decision-making from fund managers. They generally have lower portfolio turnover, which can result in fewer capital gains tax liabilities for investors. Additionally, these funds offer transparency in their holdings, as they directly reflect the components of the index they track.
What Are Vanguard Information Technology ETFs (VGT)?
The VGT tracks the performance of the MSCI US Investable Market Information Technology 25/50 Index, which includes stocks of U.S. companies in the technology sector. As a passively managed fund, VGT aims to provide broad exposure to the tech industry, encompassing hardware, software, semiconductors, and IT services. With its low expense ratio and diversified approach, VGT particularly appeals to those seeking substantial exposure to the technology sector without the high costs typically associated with active management.
What Are Technology Select Sector SPDR Funds (XLK)?
XLK focuses on providing investment results that correspond generally to the price and yield performance of the Technology Select Sector Index. This ETF captures large U.S. companies within the technology and telecommunications sectors. XLK stands out due to its strategic focus on the largest tech giants, potentially offering more stability and less volatility than funds with a broader tech market exposure. This makes XLK an attractive option for investors looking for concentrated exposure to significant players in the tech industry.
VGT vs XLK: 4 Key Differences for Investors
Investors considering VGT and XLK for their portfolios should understand the distinct features that set these ETFs apart. From dividend yields to market performance and volatility, these differences are crucial in aligning with individual investment strategies and objectives.
1. Dividend Yield and Investment Performance
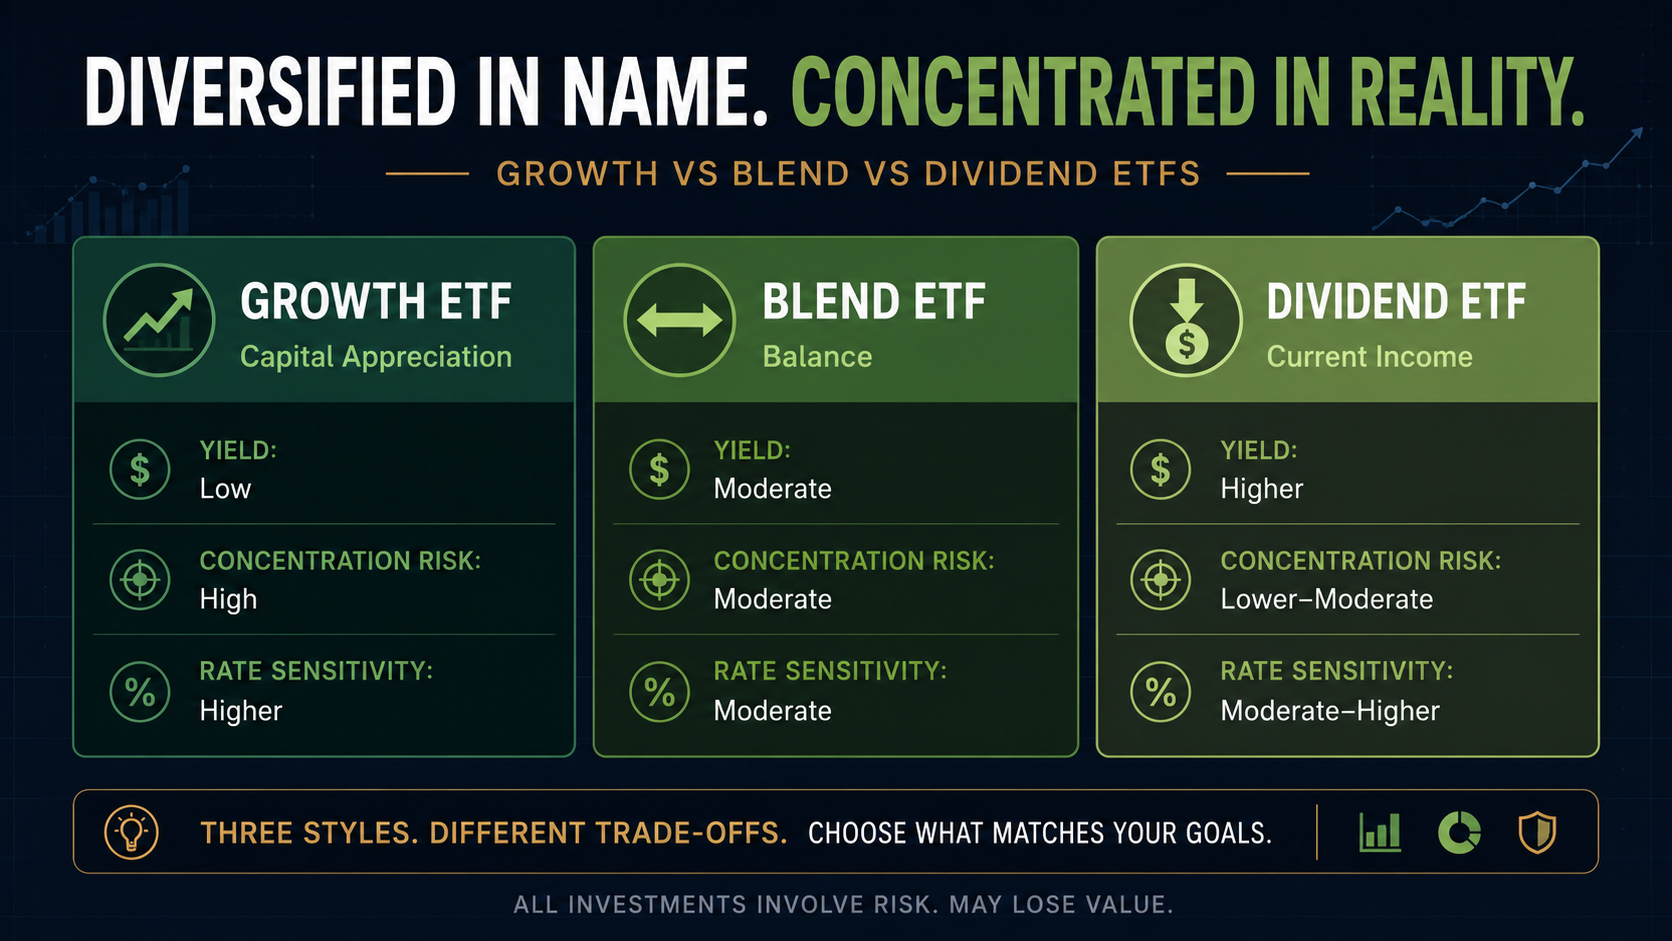
VGT and XLK exhibit variation in their dividend yields and overall investment performance, reflective of their differing fund compositions. VGT, with a broader range of tech companies — including smaller, potentially faster-growing firms — may offer lower dividend yirIn , XLK primarily includes larger, more established technology companies that generally provide higher dividend yields and steady, though typically slower, growth. XLK’s performance is more closely tied to the success of industry lecontastaders and is therefore seen as more stable but with less growth acceleration.
elds but higher growth potential. VGT has shown robust performance driven by the tech sector’s rapid growth.
2. Market Volatility and Price Fluctuations
VGT and XLK’s composition also influences their susceptibility to market volatility and price fluctuations. VGT’s broader and sometimes more speculative holdings can lead to higher volatility, reflecting the technology sector’s rapid and often unpredictable changes.
Conversely, XLK’s focus on large-cap companies, which are typically more established and financially robust, results in relatively lower volatility and more predictable price movements. This stability is particularly appealing during market downturns or periods of economic uncertainty.
3. Stock Holdings and Capitalization Strategies
The stock holdings and capitalization strategies of VGT and XLK highlight significant differences in their investment approaches. VGT includes a broader array of technology companies across various sizes, from large-cap to mid-cap, enabling investors to capitalize on growth across the tech industry’s spectrum. This diversification can be advantageous in capturing upside from emerging tech innovators alongside established giants.
On the other hand, XLK is more concentrated, primarily investing in large-cap companies that dominate the tech sector, such as Apple and Microsoft. This concentration means XLK may have less exposure to the high growth potential of smaller companies but benefits from the stability and sustained performance of top industry players.
4. Exposure to Companies and Tracking Indices
VGT and XLK differ notably in their exposure to specific companies and the indices they track. VGT is tied to the MSCI US Investable Market Information Technology 25/50 Index, which offers a comprehensive representation of the U.S. tech sector, including companies from every technology subsector. This broad exposure is ideal for investors seeking a thorough encapsulation of the tech market.
XLK tracks the Technology Select Sector Index, focusing more narrowly on leading companies in the technology and telecom sectors. This targeted approach may limit diversification but allows investors to concentrate on the most influential and financially robust tech companies, potentially reducing risk while offering substantial growth opportunities.
Invest in the Best Tech ETFs With Above the Green Line
Selecting the right technology ETF involves careful consideration of your investment goals, risk tolerance, and the characteristics of each fund. Whether you lean towards the diversified growth potential of VGT or the stability and focus of XLK, understanding your own preferences in terms of dividend yield, market volatility, and company exposure is crucial.
At Above the Green Line, we specialize in guiding investors through the complexities of ETF investments, utilizing proprietary analytics to highlight optimal entry and exit points in the market. Explore your investment options and optimize your portfolio by joining Above the Green Line today. Discover more about our membership benefits and how we can assist you in making informed, strategic decisions in tech ETF investments. With our help, you can equip yourself with the insights and tools needed to thrive in the dynamic tech investment landscape.

Related Articles
[pt_view id=”fb2451fm3r”]