
Watch List and Charts to Buy Soon.
| Daily Swing Watch List to Buy | Daily Swing Charts to Buy |
| Current Daily Swing Positions | Current Swing Charts |
| Closed Daily Swing Results | Trading Dashboard |
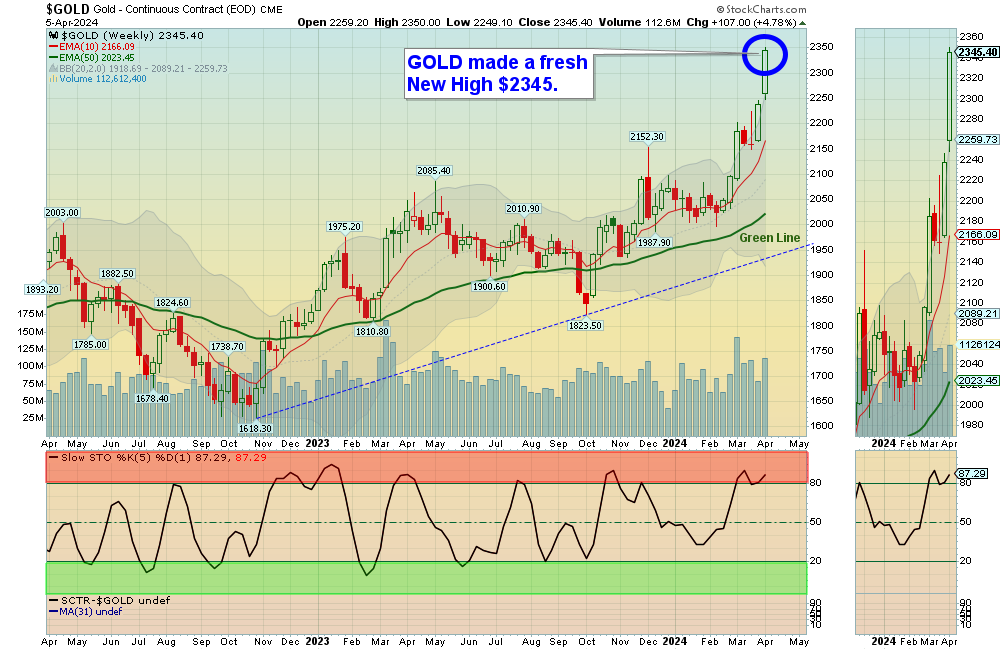
4/7/2024 Markets were lower for the week on normal profit taking and more Inflation worries. Gold and Silver made fresh new highs as the Economy is still growing from massive Gov’t. Spending.
Semiconductors & Tech Stocks are now struggling to exceed the recent highs, as Bonds have dropped on Inflation Fears (creating higher Interest Rates). Buying Volume has been very low, which warns Smart Money that the Stock Indices are over-bought and stretched Way Above the Green Lines on FOMO (Fear of Missing Out).
Eventually the S&P 500 Index will have a “double top” up here, and the Indices will meet again the Green Lines. So we are happy to earn 5% in a Money Fund and Buy again on the next FEAR Flush by the Media (to scare out investors who are Buying now).
We Buy the strongest Leaders on pull-backs. Some have pulled back on the Long Term List below. We like to Buy on Bad News like in late October, and take profits on Good News (like on Great Earnings now).
If you continue to Follow the Green Line System, your Account should flow into the Strongest areas and your Account value should be able to grow in both Bull and Bear Markets. Follow the MONEY, not the MEDIA.
______________________________________________________________________________
For the week the Dow was down 2.24%, the S&P 500 was down 0.89% and the NASDAQ 100 was down 0.80%. Many of the major Indices still have a Relative Strength below 80, so you should currently own the stronger Funds here.
The Inflation Index (CRB) was up 2.51% for the week and is Above the Green Line, indicating Economic Expansion.
Bonds were down 3.09% for the week, and are Below the Green Line, indicating Economic Expansion.
The US DOLLAR was up 0.40% for the week and is Above the Green Line.
Crude Oil was up 4.50% for the week at $86.91 and GOLD was up 4.78% at $2346.40, a new high.
_______________________________________________________________________
We are doing many micro Day Trades on our new Discord Trading Hub (free). Please join Discord on your cell phone app for the fastest Trade Alerts and Daily email notifications during the day. Other methods of notification have been too slow. Also, please check our our Live Trading Room on YouTube during Market hours.
More action this week on the Day Trading Scrolling Charts, and Day Trading Charts for Indices & Large Caps.
_______________________________________________________________________
SWING TRADE BUYS SOON:
We are now in 4 Three Star logged Swing Trading Positions for the Short & Medium Term. There are 4 investments on the Short Term Watch List.
Be patient and WAIT for Green Zone Buy Signals!
______________________________________________________________________________
LONG TERM WATCH LIST

ATGL Long Term Weekly Watchlist- Click here for scrolling charts.
PBR PETROBRAS ENERGY Bought on the Close Friday at $15.49. Target $17.75 and Stop on Close below the Green Line of $14.34
______________________________________________________________________________
Important Links| Top 100 | Stage Chart Investing | CNN Fear & Greed Index |
| Dividend Growth Portfolio | ETF Sector Portfolio | Dogs of the Dow |
| Long Term Strategy | Stage Chart Investing | Articles |
Alert! Market Risk is High (RED). The probability of successful Short Term Trades is better, when the % of stocks above the 50-day avg. is below 20.
Tell your Friends about the Green Line, and Help Animals.
______________________________________________________________________________
5 Ways to Get your Daily Money Wave Email & Trade Alerts:
-
- Emailed to your box between 3:45 – 3:50 pm EST.
- Website menu Commentary/Buy/Sell Signals
- Discord Chat. and X (Twitter) @AboveGreenLine are the fastest for Alerts (please set up “mobile notifications”)
- Text messages: Email us your Cell number & phone carrier.
Thank you,
ATGL


