By ATGL
Updated March 14, 2026
You’ve probably heard a lot about dividends per share and how “easy” it is to make money with dividends investing. But is it? The short answer is yes and no. The longer answer is that it depends. That said, before you jump on what might be a passing trend, you must take the time to understand the ins and outs of investing in dividends so you can leverage dividends per share. Otherwise, you’ll end up disappointed that you didn’t do your due diligence. Luckily, this article will provide a detailed guide on what dividends per share are and how to calculate them.
Dividends per share are one of the foundational metrics used to evaluate dividend-paying companies. Investors who focus on building long-term income streams often analyze DPS alongside payout ratios, dividend growth rates, and company earnings. For a broader framework on how these metrics work together in a disciplined income strategy, see the Dividend Growth Guide, which explains how investors evaluate dividend sustainability and long-term dividend growth potential.
What Is a Company’s Dividend per Share (DPS)?
Before the concept of dividend per share (DPS) became popular, companies didn’t have a standardized way of distributing profits (dividends) to their shareholders. Sure, shareholders would receive dividends, but it wasn’t on a per-share basis. Companies would give shareholders a fixed dividend amount that board members had approved. This method had a lot of inconsistencies and was somewhat unfair. Today, many companies have embraced the DPS dividend policy to achieve transparency and earn the trust of their shareholders.
Dividends per share is a financial metric that measures the returns a company gives back to its shareholders in the form of dividends for each outstanding share of its stock. These dividends don’t have to be cash dividends—they can also be stock dividends. In simpler terms, DPS represents the portion of a company’s profits that it distributes to each share outstanding.
DPS is commonly confused with another financial metric known as Earnings per Share (EPS). While both involve per-share calculations, the two serve two distinct purposes in measuring a company’s performance.
Earnings per share refers to the percentage of earnings a company allocates to each of its shares outstanding. It is a profitability metric that indicates the company’s ability to generate earnings for its shareholders. To calculate the EPS, you should divide the organization’s net income (after the preferred stocks dividends, taxes, and plowback (more on how to calculate blowback)) by its outstanding shares.
What Are the Benefits of Calculating DPS?
If you’ve taken the dividends investing route, there are several advantages you stand to gain.
Helps You Determine the Dividend Income You Will Receive
Calculating the dividend per share allows you to estimate the income dividends you can expect from investing in a particular company. You can project the DPS earnings you’ll likely receive, which is vital for financial planning and investment decision-making.
Indicates the Financial Soundness of the Company
As an investor, you can use DPS as a factor to assess the financial strength of a company before making investment decisions. This is because increasing or consistent dividends per share over time suggests a company has a steady income and is financially stable, meaning it can return value to its shareholders.
Allows You To Compare Companies and Their Profitability
Before investing in a company’s shares, you can use the DPS as part of your investment strategy by comparing its dividend payment performance with other companies. A company’s dividend and stock price directly translate to its financial stability. For instance, if a company’s DPS declines continuously, its investors will likely sell their stocks, driving down the stock price and profitability. So, if you’re considering dividend reinvestment plans, you may have to reconsider this decision.
What Is the DPS Formula?
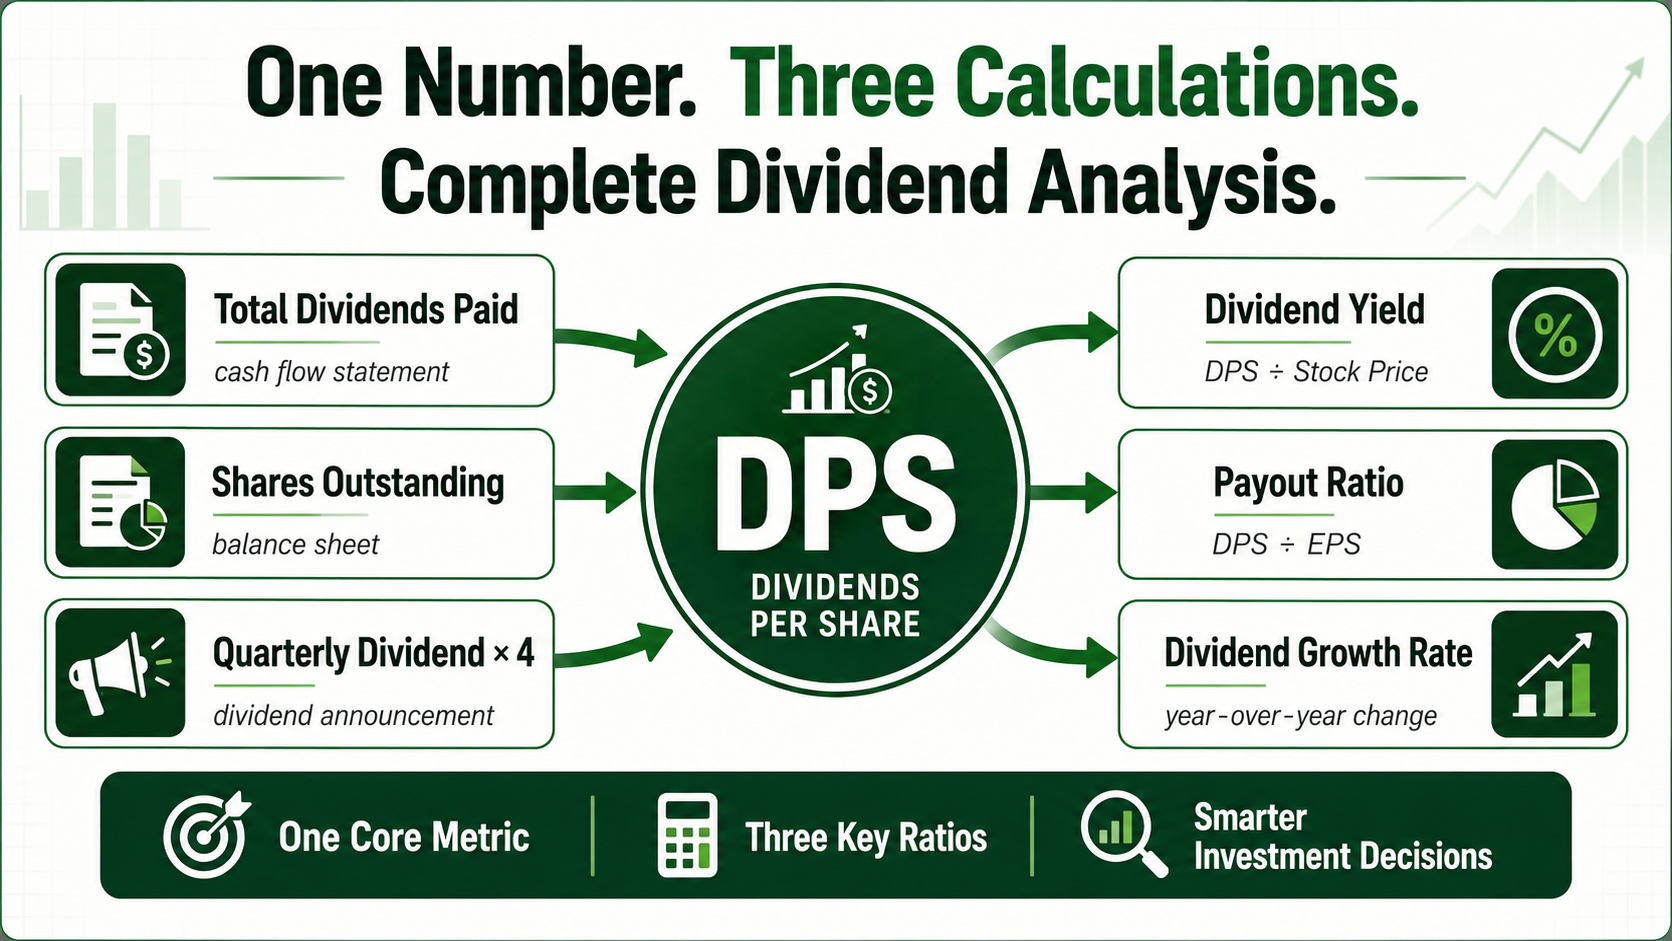
From the definition, DPS is calculated by dividing the total amount of dividends paid out by a company divided by the number of outstanding shares. Therefore, the dividend per share formula is as follows:
Dividends per Share (DPS) = Total Annual Dividends Paid / Number of Outstanding Shares
Where;
- Total Annual Dividends Paid is the aggregate amount of money that a company distributes to its shareholders as dividends during a specific period.
- Number of Outstanding Shares represents the total number of shares of a company’s stock currently held by investors.
How Can You Calculate DPS From Income Statements?
It’s also possible to calculate DPS using a company’s financial statements, specifically income statements. This method relies on the relationship between the dividend payout ratio and earnings per share to determine the dividends paid per share.
As such, the formula for calculating the DPS using income statements is as follows:
Dividend per Share (DPS) = Dividend Payout Ratio x Earnings per Share (EPS)
Where;
- Dividend Payout Ratio represents the percentage of earnings that a company distributes to shareholders in dividends. It’s calculated by dividing the total dividends paid by the net income or earnings (the total profit or earnings of the company after deducting all expenses, taxes, and other costs).
- Earnings per Share (EPS) is a measure of a company’s profitability and is calculated by dividing the net income by the number of outstanding shares.
What Is an Example of a DPS Calculation?
Company X reported a net income of $1 million for the financial year 2022/2023. It paid out dividends of $500,000 to its shareholders, who held 100,000 outstanding shares.
Using the formula: Dividends per Share (DPS) = Total Dividends Paid / Number of Outstanding Shares
DPS = 500,000 / 100,000
Company X’s DPS would be $5.
Using the income statement method:
First, we’ll calculate the Dividend Payout Ratio (DPR):
Dividend Payout Ratio (DPR) = Total Dividends Paid / Net Income
                            = 500,000 / 1,000,000
                            = 0.5
Then, we calculate Earnings per Share (EPS):
Earnings per Share (EPS) = Net Income / Number of Outstanding Shares
                         = 1,000,000 / 100,000
                         = 10
Therefore, Company X’s DPS = 0.5 x 10, or $5.
Reach Your Investment Objectives With Above the Green Line
As already established, dividends per share is an important financial metric for making informed decisions related to dividend investing, especially if you’re in the market for profitable stocks. If a company consistently registers a declining DPS, its stock price will take a hit, essentially indicating that it might not be a great investment for you.
Above the Green Line’s Dividend Growth Investment Strategy is your best bet to choose the right stocks and ensure you have a steady income. We help investors find companies that carefully choose their dividend yields, ensuring they increase and maintain their dividend payout year after year. This strategy also gives you insight into a company’s preferred stocks, so you’re guaranteed to earn dividends regardless of tough economic times.

Related Articles
[pt_view id=”b47aec5l7b”]