Calculating the rate of return is a fundamental concept in finance and investment analysis, providing a crucial metric to assess the performance of an investment over a specific period of time. The rate of return, often expressed as a percentage, quantifies the gain or loss on an investment relative to its initial cost. This metric serves as a key tool for investors, financial analysts, and decision-makers to evaluate the profitability and efficiency of various assets or investment portfolios. By understanding how to find the rate of return, individuals can make informed investment decisions, compare the performance of different assets, and assess the overall success of their investment strategies. This overview will delve into the methodologies and formulas used to calculate rate of return, shedding light on its significance in the financial landscape.
What is a Simple Rate of Return (RoR)?
A Simple Rate of Return (RoR) is a financial metric used to measure the profitability of an investment. It represents the percentage increase or decrease in the value of an investment relative to its original cost plus any additional income generated during the holding period. The RoR is a general expression that encompasses the Return on Investments (ROI). Both metrics used to assess the profitability or performance of an investment, but they are calculated slightly differently.
It’s important to note that the Simple Rate of Return does not account for the time value of money, and it assumes that any income generated is reinvested at the same rate. As a straightforward measure of profitability, the Simple Rate of Return is useful for quick assessments of investment performance but may not capture the full complexity of returns over longer time periods or in more intricate financial scenarios.
While RoR does not account for the time value of money, capital gains do contribute to the overall positive return, and they are a crucial factor in assessing the profitability of an investment. ROR provides a percentage measure of the total return relative to the initial cost of investment, taking into account both capital gains and any additional income generated during the holding period.
A related concept to the RoR is the annual return. The relationship between the RoR and the annual return lies in the time frame used for the calculation. If the simple rate of return is calculated over a one-year period, it essentially represents the annual return for that specific year. However, when considering multiple years, the simple RoR for each year is not compounded, and thus the annual rate of return is calculated differently to account for the compounding effects – more specifically, annual growth rate considers compounding effects. In that case, the Gordon Growth Model or Dividend Discount Model (DDM) are best utilized.
Simple RoR Formula and Calculation Example
The Rate of Return formula (RoR), also commonly referred to as the percentage of return, provides a straightforward method for assessing the profitability of an investment by comparing its current value to the initial cost.
The formula for calculating the Simple Rate of Return, which includes capital gains, is as follows:
RoR= (Ending Value−Beginning Value + IncomeBeginning Value)×100
In this formula:
- Ending Value is the current value of the investment.
- Beginning Value is the initial cost or investment amount.
- Income refers to any additional earnings or cash flows generated by the investment
The resulting percentage indicates the return on stock over a specific period. A positive rate represents a profit, while a negative RoR indicates a loss.
For example, consider an investment with an initial cost of $10,000, a current value of $12,500, and additional income of $1,000. Applying the RoR formula, we get
RoR= (12,500−10,000+1,00010,000) ×100 = 35%
This indicates a 35% return on the initial investment, making the RoR a useful metric for quick assessments of investment profitability.
Benefits and Limitations of a Simple RoR
The Simple Rate of Return (RoR) offers several benefits and limitations as a metric for assessing investment performance. One of its key advantages is its simplicity, providing a quick and easy-to-understand measure of profitability. This makes it accessible to a wide range of investors, from novices to seasoned professionals, enabling them to make swift assessments of the returns on their investments. Moreover, the RoR is particularly useful for evaluating the success of shorter-term projects or investments.
Its simplicity however comes with limitations. The RoR does not consider the time value of money, ignoring the impact of compounding over time. Additionally, it assumes that any income generated is reinvested at the same rate, which may not reflect real-world scenarios. As a result, the Simple RoR might provide a skewed representation of long-term investment performance. While it serves as a handy tool for initial assessments, investors should be mindful of its limitations and consider other metrics for a more comprehensive analysis of their investment portfolios.
How Can You Overcome Simple RoR Limitations?
To overcome the limitations of the Simple Rate of Return (RoR), investors can incorporate additional financial metrics and analytical tools into their assessment strategies. One way is to use more sophisticated measures, such as the Compound Annual Growth Rate (CAGR), which accounts for the compounding effect over time. CAGR considers the geometric progression of returns and provides a more accurate representation of long-term performance. Investors can also utilize Net Present Value (NPV) and Internal Rate of Return (IRR) calculations, which take into account the time value of money and provide insights into the present and future value of cash flows.
Furthermore, a comprehensive analysis involves considering risk-adjusted metrics like the Sharpe ratio, which assesses the return earned relative to the level of risk taken. By combining these tools and metrics, investors can obtain a more nuanced and accurate understanding of their investment performance, addressing the limitations inherent in relying solely on the Simple RoR.
Calculate Internal and Annualized Rate of Return
Calculating the Internal Rate of Return (IRR) and Annualized Rate of Return involves complex financial calculations, but these metrics are invaluable for evaluating investment profitability. The IRR is the discount rate that makes the net present value of cash flows from an investment equal to zero. To calculate IRR, one typically uses trial and error or specialized software. The formula for calculating the IRR is shown below.
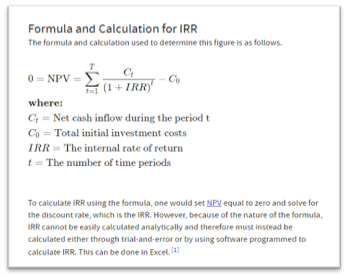
The Annualized Rate of Return is an extension of the IRR over a specific time frame, often expressed as a percentage. To calculate it, you need to consider the compounding effect and the length of the investment period. The formula for Annualized Rate of Return involves raising the total return to the power of (1/n), where ‘n’ is the number of years, and subtracting 1.
While these calculations may seem intricate, they provide a more accurate representation of investment performance, considering both the timing and magnitude of cash flows. Specialized financial software or spreadsheet tools can simplify these calculations for investors seeking a comprehensive view of their investment returns.
Identify Return on Invested Capital
Identifying Return on Capital (ROC) is a critical aspect of financial analysis for investors and businesses seeking to assess the efficiency and profitability of capital utilization. ROC measures the return generated on the capital invested in a business or investment project. The formula for ROC involves dividing the net income or profits by the capital employed, which includes both equity and debt. A higher ROC signifies effective capital utilization and superior returns, reflecting a company’s ability to generate profits relative to the invested capital. Investors often use ROC to evaluate the performance of businesses across industries, comparing the return on capital to industry benchmarks. A consistently high ROC is indicative of efficient capital management and may attract investors seeking sustainable and profitable opportunities. Identifying return on capital is crucial for making informed investment decisions and optimizing financial strategies for businesses aiming to maximize shareholder value.
Define Return on Equity
Return on Equity (ROE) is a key financial metric that measures the profitability of a company in relation to its shareholders’ equity. It provides insights into how efficiently a company utilizes shareholder funds to generate profits. The ROE formula is calculated by dividing the net income by the average shareholders’ equity and expressing the result as a percentage. A higher ROE indicates better efficiency in generating profits with the available equity. ROE is a fundamental indicator of a company’s financial health and management effectiveness, making it a crucial metric for investors and analysts. By understanding ROE, stakeholders can assess the company’s ability to deliver value to shareholders and compare its performance to industry benchmarks or competitors. It serves as a valuable tool in financial analysis, aiding in decision-making processes related to investments and strategic planning for both investors and company management.
Make the Best Investment Decisions with Above the Green Line
Rate of return (RoR) is a fundamental metric in finance, measuring the profitability of an investment over a specific period. Making the best investment decisions involves a comprehensive understanding of financial metrics and market trends. Companies like Above the Green Line play a significant role in guiding investors to make informed decisions. By providing expert insights, market analysis, and trend identification, such services empower investors to optimize their portfolios and navigate the dynamic landscape of financial markets. Leveraging experts like those at Above the Green Line can enhance the ability to identify opportune moments for buying or selling stocks, ultimately contributing to making well-informed and potentially more successful investment decisions.
For those interested in learning how to calculate the Rate of Return and making the best investment decisions, we invite you to join above the Green Line.


