Markets were down slightly today after a good rally in the morning. Many Investments are down in the Green Zones (see list below), which normally means a rally soon.
The Leaders and the Strongest NASDAQ 100 and Small Cap Indices are quickly coming down to their Green Zones for Money Wave Buys soon.
Please be patient, and WAIT for Money Wave Buy Signals.
Crude Oil was up again at $72.50.
_____________________________________________________________________________________
The Following Investments will probably have a Money Wave Buy Signal soon.
(Slow Stochastic Closing > 20) on today’s Close.
BUYS TODAY
ADBE ADOBE SYSTEMS Money Wave Buy today. Target is $258. Place Sell Top Loss below recent Support of $235.87 on the Close.
M MACY’S INC. Money Wave Buy today. M will not be logged, as the Volume is below average.
We will “Not Log” trades if the Reward/Risk is not at least 2:1.
Money Wave Buys soon for:
BA BOEING CO.
EA ELECTRONIC ARTS
GRUB GRUBHUB INC.
MOMO MOMO, INC.
PFB PFB ENERGY
RL POLO RALPH LOREN
SQ SQUARE INC.
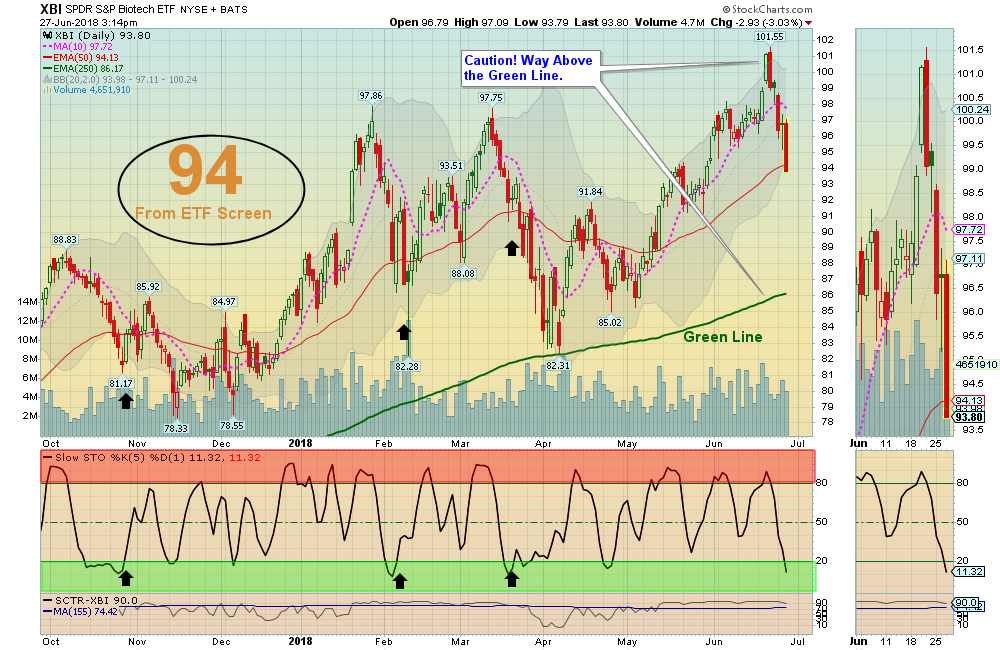
XBI BIOTECH FUND
Please be patient and wait for Money Wave Buy Signals. We will email you when they are ready. Click on Watch List.
Emotions are very high now, so please do not Buy unless you are VERY NIMBLE. The Leaders are still Way Above the Green Lines (all Investments eventually return to their Green Lines).
______________________________________________________________________________________
SELLS TODAY
EXIT USO US OIL FUND on the Close today, or have a tight Sell Stop below it to capture a 9 % Gain.
Please Check PORTFOLIO (Open Positions) and adjust your Sell Stops.
Click for CLOSED POSITIONS.
Many like to Buy the day before, near the Close, if the Money Wave is going to create a Buy Signal (Closing > 20).
Don’t Buy if the Investment has already popped up too much. Money Wave Buys are usually good for a 3-6 % move in a few days. We will “Not Log” trades if the Reward/Risk is not at least 2:1.