Above the Green Line -01
  • Market Insights
        • Commentary
          • Daily
          • Weekly
        • BUY / SELL SIGNALS
          • Trade Posts
          • Recent Trade Alerts
          • Recent Day Trades
        • BLOGROLL
          • Dividend Growth Blog
          • ETF Sector Blog
          • Dow Dogs
          • TPOW Blog
  • Strategies
        • SWING TRADING
          • Current Positions
          • Watchlists
          • Closed Positions
          • Candidates - TOP 100
          • Specialty Stocks
        • WEEKLY STOCK PICK
          • TPOW Charts
          • TPOW Performance
          • TPOW Strategy Guide
          • TPOW Performance Dashboard
        • DAY TRADING
          • Watch List
        • ATGL DASHBOARD
        • ETF STRATEGIES
          • ETF Sector Rotation
          • ETF Sector Portfolio
        • DIVIDEND GROWTH
          • Dividend Growth Portfolio
          • Dividend Calendar
        • DOGS OF THE DOW
          • Dogs of the Dow Portfolio
          • DOW 5 Portfolio
  • Markets
        • US MARKET
          • Commodities
          • Energy
          • Precious Metals
          • Volatility
        • GLOBAL MARKETS
          • Market Indices
          • Economic Calendar
          • FOREX Heat Map
          • FOREX Cross Rates
          • Crypto Currency Market
  • Investing
    • Discord Community
    • Dashboard
  • Resources
        • ARTICLES
          • Dividend Growth Model Articles
          • ETF Articles
          • Investment Strategies Articles
          • Market and Economic Insights
          • Stock Trade Articles
          • Stock Reviews
        • TOOLS
          • Stock Scanners
          • Charting Software
          • Brokerage Firms
        • STOCK CHARTS
          • Key Components
          • Reading Charts
          • Drawing Stock Charts
          • Identifying Trends
        • RETIREMENT PLANNING
  • About
    • Contact Us
    • How to Win
    • #1 At Stockcharts
    • Disclaimer
    • FAQ
  • Log In
  • Subscribe

October 12, 2023

Money Wave Alert! Oct 12, 2023

TBT Chart
A Buy Signal today on Inverse Bond Fund (TBT) was good for a 5% Pop.

Markets were mostly down today as Long term Bonds rolled over and dumped over 2%. Wave 5 up should have 5 waves in it, and it looks like wave 1 up was complete after lunch today. Then the Indices would normally retest the recent lows, and the S&P 500 needs to make a higher low this time down to remain Bullish.

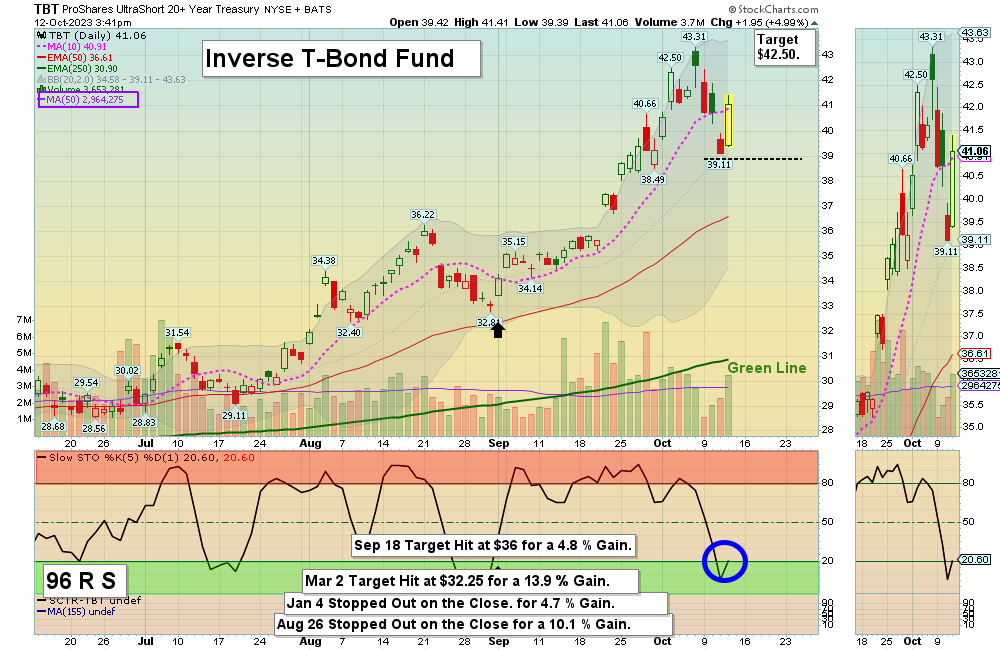
Bonds needed to go back down to retest the lows, so TBT Inverse Bond Fund had a Buy Signal good for a 5% Pop in a few days.

The S&P 500 Index bounced up 4 % from the Green Line now, and Leaders are over bought for the short term. The S&P 500 stalled out at the 50-day average, which is normal.

When Bonds finally have a good Double Bottom, maybe Buy more of the Leaders that we bought last week.

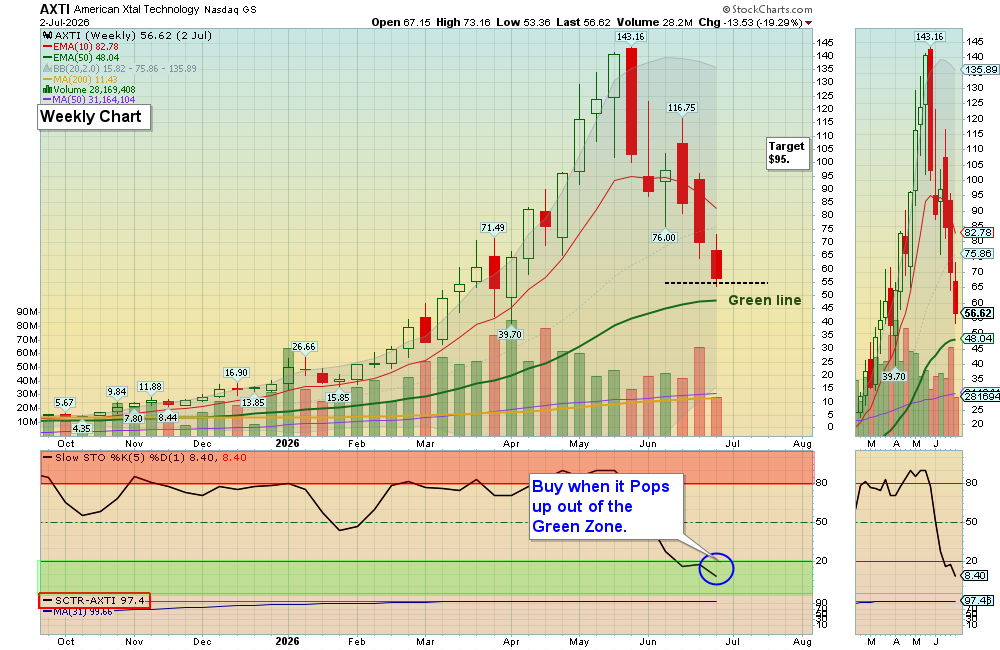
Wait for more Buy Signals soon, coming up out of the Green Zones.  CHARTS  The best moves happen when the S&P 500 Index is also coming up out of the Green Zone. 

__________________________________________________________________________

BUYS TODAY   10/12/2023        

TBT      INVERSE T-BOND FUND      Money Wave Buy today, but TBT will not be Bought or Logged as it was already up 5% today. Maybe you got some early on the Triple Buy Signal.

UUP      US DOLLAR FUND        Money Wave Buy Signal today, buy UUP is almost back up to the $30 Target. AVOID.

We will “Not Log” trades if the Reward/Risk is not at least 2:1, or Low Volume. These have more risk. 

BUYS TOMORROW                  

AAOI       APPLIED OPTOELECTRONICS        Wait for Daily Money Wave Close > 20 with High Volume.     

Shop for a better price earlier in the day with Triple Buy Signal, on the same day that a Daily Money Wave Buy Signal will occur.  

BUYS SOON                    

CCCS      CCC INTELIGENT SOLUTIONS      Money Wave must Close in the Green Zone.     

IMGN      IMMUNOGEN INC.      Wait for Daily Money Wave Close > 20 with High Volume.     

Please be patient and Wait for Money Wave Buy Signals.  We will email you when they are ready. Follow on the WATCH LIST.   

Many like to Buy the Swing Trades just before the Close, if the Money Wave is going to create a Buy Signal (Closing > 20 and up out of the Green Zone). Don’t Buy if the Security has already popped up too much. Money Wave Buy Signals are usually good for a 3-6 % move in a few days.

SELLS TODAY       NONE TODAY     

________________________________________________________________________

DAY TRADING SETUPS.  Today 1 trade for $140. Day Trading Alerts are now being sent out on our new Discord Site with Live Chatting. Please install Discord app on your pc or cell for mobile notifications. Also follow our YouTube Live Stream for quick trades. Or look for Triple Buy Pops (3 Green Circles). Big Movers today:  AAOI (+5%) LABD (+12%) & TZA (+7%). Try out the Side by Side layout.      

DAY TRADING FOR INDICES & LARGE CAPS CHARTS.

Bonds were down today and are Below the Green Line.  

Crude Oil was down $0.11 today at $83.83.

MY TRADING DASHBOARD 
SWING TRADING CURRENT POSITIONS
DAY TRADING SETUPS
TRADE ALERTS
GREEN LINE CHARTS AT STOCKCHARTS
ARE YOUR INVESTMENTS ABOVE THE GREEN LINE?
GREEN LINE RULES
ETF SECTOR ROTATION SYSTEM   
New TOP 100 LIST Updated Oct 1, 2023

We will “Not Log” trades if the Reward/Risk is not at least 2:1, or Low Volume. These have more risk. 

Related Post

TBT

Related Post

– TBT

Subscribe to Our Newsletter

AGL Logo

Get our eBook Now!

Candlestick - A Swing Traders Friend

We don’t spam! Read our privacy policy for more info.

You’ve been successfully subscribed to our newsletter!

Voted #1 at Stock Charts

SH Chart
Inverse S&P 500 Fund (SH) will have a Money Wave Buy today.

Help Us Help Animals

Help Us Help Animals

Recent Comments

  • Market Breadth Indicators: A Trader’s Guide to Early Trend Detection on Backtesting: Definition and How a Trading Strategy Backtest Works
  • Island Reversal Pattern: Definition and Formation Explained on Double Top Pattern: How to Identify and Trade This Reversal Signal
  • Channel Pattern Guide: What It Is and Why It Matters on A Guide to Forecasting Using Moving Averages
  • What Is a Broadening Bottom Chart Pattern? Full Guide on Bull vs. Bear Market: An Investor’s Guide to Market Phases
  • ATGL Weekly Money Flow - 2025-05-11 on ATGL Top Pick of the Week! Apr 6, 2025

Become a Green Liner!

Help me make more Money in the Stock Market.

ON ATGL

  • DashBoard
  • Weekly Commentary
  • Daily Buy / Sell Signals
  • Day Trade Setup
  • Trading Rooms

Design & Develop By Pixelvect

STRATEGIES

  • Swing Trading
  • ATGL Pick of the Week
  • Dividend Growth
  • ETF Sector Rotation
  • Dogs of the Dow

HELP

  • ATGL Trading Rules
  • FAQ
  • Account Maintenance
  • Contact US
  • Join

FOLLOW US

Instagram Linkedin Twitter Facebook

© COPYRIGHT 2024 · ABOVETHEGREENLINE.COM · ALL RIGHTS RESERVED · PRIVACY · TERMS · CONTACT · WATCHLIST · CURRENT