10/8/2023 Markets finally reversed the down trend and Closed higher. The Media had another excellent FEAR Flush designed to cause Dumb Money to Sell out, after Dumb Money Bought at the August highs on GREED & FOMO (Fear of Missing Out). All of the classic bottoming signs: 1. VIX FEAR Index went from a low of $13 (Sell) to $20.48 (Buy) up 57%, 2. CNN Fear and Greed Index dropped from 82 (Sell) to 15 (Buy) this week, and 3. S&P 500 Stocks above the 50-day avg. dropped from 82 (Sell) to 8 (Buy).
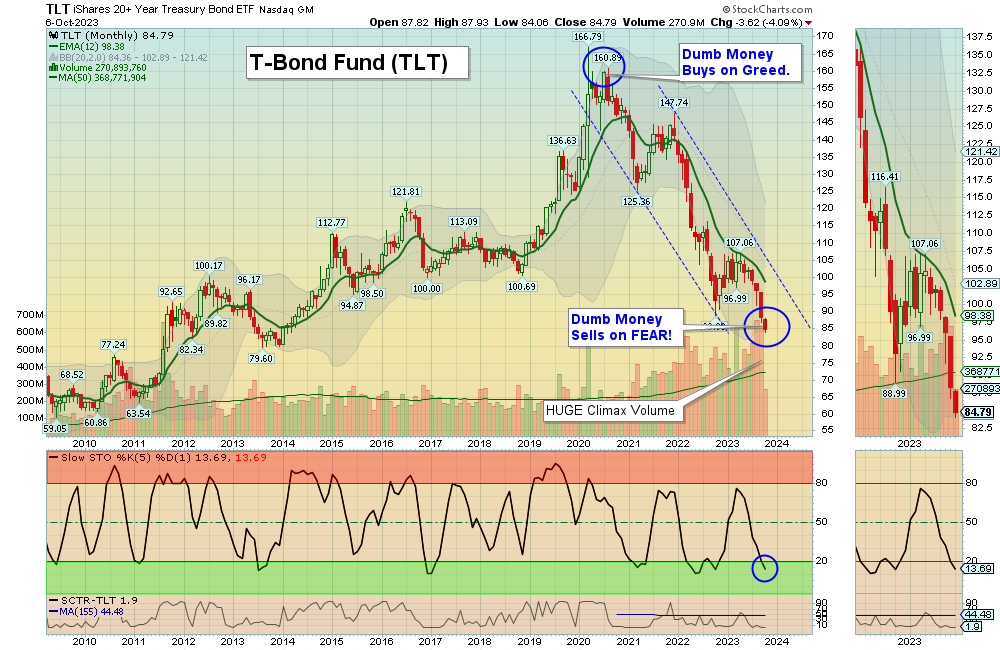
Stocks needed for T-Bonds to bounce up. Eventually Bonds will meet again with the Green Line, when the FEAR subsides. It looks like the A-B-C Correction of Wave 4 down of the S&P 500 Index might have ended this week. Then we should finally see the Markets go up on Wave 5 to retest the August high.
Last October when Bonds went down and bounced up from the Support, the S&P 500 rallied 15%. Try to Buy Investments that held above the 50-day, as they normally bounce up first.
If you continue to Follow the Green Line System, your Money should flow into the Strongest areas and your account value should be able to grow in both Bull and Bear Markets. Follow the MONEY, not the MEDIA.
_____________________________________________________________________________________________
For the week the Dow was down 0.25%, the S&P 500 was up 0.48% and the NASDAQ 100 was up 1.79%. Many of the major Indices still have a Relative Strength below 80, so you should currently own the stronger Funds here.
The Inflation Index (CRB) was down 2.68% for the week and is Above the Green Line, indicating Economic Expansion.
Bonds were down 4.09% for the week, and are Below the Green Line, indicating Economic Expansion.
The US DOLLAR was down 0.03% for the week and is Above the Green Line.
Crude Oil was down 8.81% for the week at $82.79 and GOLD was down 1.12% at $1845.20.
_____________________________________________________________________________________
We are doing many micro Day Trades on our new Discord site (free). Please join Discord on your cell phone app for day trading mobile notifications during the day. Other methods of notification have been too slow. Also, please check our our Live Streaming on YouTube during Market hours.
More action this week on the Day Trading Scrolling Charts, and Day Trading Charts for Indices & Large Caps.
_____________________________________________________________________________________________
MONEY BUYS SOON:
We are in now in 10 logged Swing Trading Positions (fully invested) for the Short & Medium Term. There are only 3 investments on the Short Term Watch List.
Be patient and WAIT for Green Zone Buy Signals!
LONG TERM INVESTMENTS:
Long Term Scrolling Charts (Real Time)
AI C3 AI INC. Buy above $30.08 with High Volume with a 3% Trailing Sell Stop Loss below it.
BLDR BUILDERS FIRSTSOURCE Wait for next Weekly Money Wave Close > 20 with High Volume.
GBTC GRAYSTONE BITCOIN FUND Buy above $21.10 with High Volume with a 3% Trailing Sell Stop Loss below it.
ITB HOME BUILDING FUND Wait for next Weekly Money Wave Close > 20 with High Volume.
ORCL ORACLE CORP. Wait for next Weekly Money Wave Close > 20 with High Volume.
PINS PINTEREST INC. Buy above $30.86 with High Volume with a 3% Trailing Sell Stop Loss below it.
SH INVERSE S&P 500 FUND Buy above $17.71 with High Volume with a 3% Trailing Sell Stop Loss below it.
TAL TAL EDUCATION GROUP Buy above $10.45 with High Volume with a 3% Trailing Sell Stop Loss below it.
W WAYFAIR INC. Buy above $90.71 with High Volume with a 3% Trailing Sell Stop Loss below it.
WW WEIGHT WATCHERS INT’l. Buy above $12.13 with High Volume with a 3% Trailing Sell Stop Loss below it.
__________________________________________________________________________________________
My Trading Dashboard
Swing Trading Scrolling Charts
Day Trading Scrolling Charts
Click for Watch Lists
Click for Current Positions
Click for Closed Positions
Updated Top 100 List Oct 1, 2023
Dividend Growth Portfolio
Updated ETF Sector Rotation System
Dogs of the DOW System
Long Term Strategy for IRAs & 401k Plans
CNN Fear & Greed Index
Scrolling Stage Chart Investing Charts
Alert! Market Risk is Low (GREEN). The probability of successful Short Term Trades is better, when the % of stocks above the 50-day avg. is below 20.
Tell your Friends about the Green Line, and Help Animals.
________________________________________________________________________________
QUESTION: Jim S. writes “Why do you use the 250 vs 200 day or any other moving average? And, in a bear market, are you concerned that your Money Wave (slow sto line) might get stuck in the Green Zone for an extended period or give false breakout buy signals?
ANSWER: Hi Jim. The 250-day average (Green Line) has been back tested and has fewer “false Sell Signals” than the 200-day. The question should be: Why do most investors use the inferior 200-day average?
In the next Bear Market, we should be in Inverse Funds (like SH) which we were in the 2008 Bear (with good success)… In a Bear Market, most investments will be Below the Green Lines. The Green Line Rules do not allow us to Buy weaker investments Below the G L.
But historically there will always be investments Above the Green Lines, and we should have them for you.
Good trading and tell your friends!
ATGL
Related Post
– AI