Above the Green Line -01
  • Market Insights
        • Commentary
          • Daily
          • Weekly
        • BUY / SELL SIGNALS
          • Trade Posts
          • Recent Trade Alerts
          • Recent Day Trades
        • BLOGROLL
          • Dividend Growth Blog
          • ETF Sector Blog
          • Dow Dogs
          • TPOW Blog
  • Strategies
        • SWING TRADING
          • Current Positions
          • Watchlists
          • Closed Positions
          • Candidates - TOP 100
          • Specialty Stocks
        • WEEKLY STOCK PICK
          • TPOW Charts
          • TPOW Performance
          • TPOW Strategy Guide
          • TPOW Performance Dashboard
        • DAY TRADING
          • Watch List
        • ATGL DASHBOARD
        • ETF STRATEGIES
          • ETF Sector Rotation
          • ETF Sector Portfolio
        • DIVIDEND GROWTH
          • Dividend Growth Portfolio
          • Dividend Calendar
        • DOGS OF THE DOW
          • Dogs of the Dow Portfolio
          • DOW 5 Portfolio
  • Markets
        • US MARKET
          • Commodities
          • Energy
          • Precious Metals
          • Volatility
        • GLOBAL MARKETS
          • Market Indices
          • Economic Calendar
          • FOREX Heat Map
          • FOREX Cross Rates
          • Crypto Currency Market
  • Investing
    • Discord Community
    • Dashboard
  • Resources
        • ARTICLES
          • Dividend Growth Model Articles
          • ETF Articles
          • Investment Strategies Articles
          • Market and Economic Insights
          • Stock Trade Articles
          • Stock Reviews
        • TOOLS
          • Stock Scanners
          • Charting Software
          • Brokerage Firms
        • STOCK CHARTS
          • Key Components
          • Reading Charts
          • Drawing Stock Charts
          • Identifying Trends
        • RETIREMENT PLANNING
  • About
    • Contact Us
    • How to Win
    • #1 At Stockcharts
    • Disclaimer
    • FAQ
  • Log In
  • Subscribe

December 17, 2017

Green Line Weekly Dec 17, 2017

DOW Chart
DOW Cruising Up as Investors Feel Great!


12/17/2017:  Markets were higher for the week, with the Dow and the S&P hitting all-time highs and gaining about 1% each for the week. Stocks jumped after changes were made to the tax reform bill and Markets are expecting the votes to pass the bill next week.

The Federal Reserve raised the Fed Funds rate a quarter-point as expected.

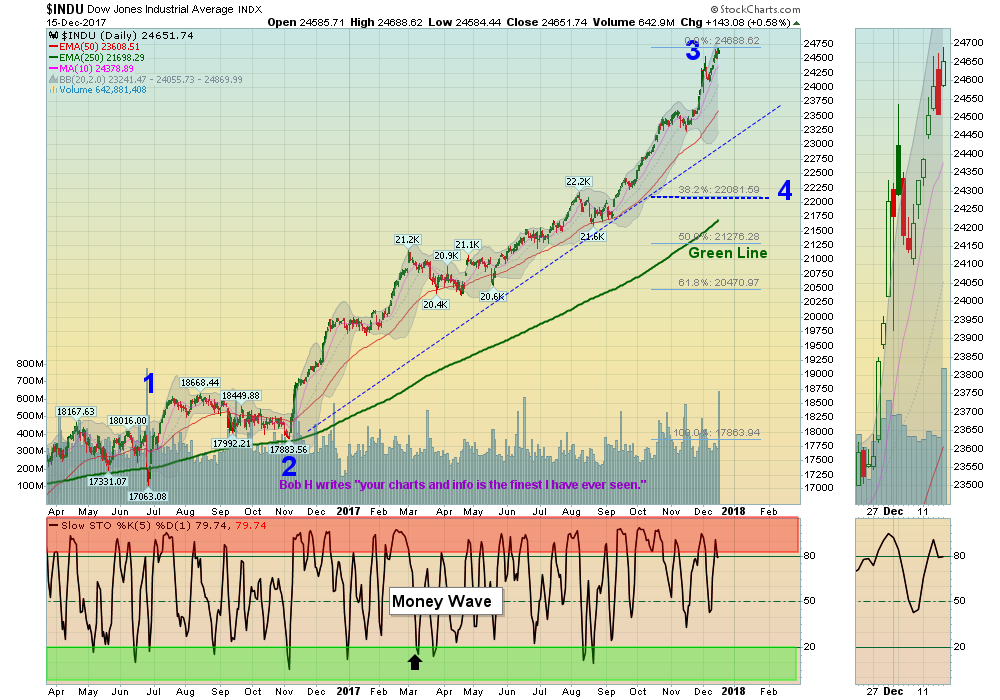
Please be aware that the S&P 500 has not RETURNED to the Green Line in over a year, as Hope and Confidence are very high.  Please have some Cash available when the Markets return to the G L.

Crude Oil was unchanged for the week at $57.33, and GOLD was up 0.73%.

___________________________________________________________________________________________

MONEY WAVE BUYS SOON:    We are currently in 5 logged Open Positions, for the Short Term. There are 3 Investments on the Short Term Watch List, so be patient and WAIT for Green Zone Buys!

______________________________________________________________________________________________

LONG TERM TRADES 

The Funds below are currently out of favor, but historically these could possibly Double or more from these lower levels. We are looking for a good Entry Point for these, but need the entire Economy  & Inflation to pick up speed:

DBC   COMMODITY FUND   Relative Strength is back Below 90.
GRPN   GROUPON INC.    Wait for Break Out above $5.99 on High Volume.
JJC     COPPER FUND         Relative Strength has dumped, and Volume is Low.
KOL    COAL FUND        Closed above $15.44, but the Volume is poor so holding off.
LL   LUMBER LIQUIDATORS   Relative Strength is Below 90.
REMX   RARE EARTH FUND   Wait for Green Zone Buy on the Weekly Chart.
TWTR   TWITTER INC.   Wait on Break Out Above $25.25.
UGA   US GASOLINE FUND     Volume is too low… Break Out Above $33.07.
VALE   VALE DE RIO    Wait for Break Out above $11.72 on High Volume.

___________________________________________________________________________________________

Click for  Portfolio (Open Positions)  
Click for  Watch List
Click for  Closed Positions


Alert! Market Risk is HIGH (Red Zone). The probability of successful Short Term Trades is lower, when the S&P 500 is Way Above the Green Line. Even the Strongest Funds can get chopped up. Either take quick gains from Money Wave Pops, or STAY IN CASH & WAIT for a larger correction.

Tell your Friends about the Green Line, and Help Animals.


QUESTION:   Kerry writes:  “I am curious about  your thinking on TRXC in view of its recent market movement and transfer to the long term list.  It seems that there might be something that you particularly like about this security in spite of its continuing  price declines.  I wonder if you could explain that to me.  I am not arguing or questioning the process—just interested in understanding it.”  

Thanks so much in advance.

ANSWER:  Hi Kerry. Usually when an Investment goes up on HUGE Volume and High Relative Strength, Tammy will Buy on the Good News (at the top).  

Smart Money SELLS!  Then the Investment will slowly fade back down toward the Green Line on low Volume… Normally the Investments will try the Highs again, so Smart Money will buy when Tammy is selling… The hard part is picking the BOTTOM… If you had bought at $4.50 in Oct., you would probably be Blowing Out of it now with a HUGE Loss.

TRXC went up HUGE in 4 days on High Volume in Oct. (called Impulse Wave).  Now it is Correcting slowly on Low Volume (Correcting Wave) but still has 98 Relative Strength.   The previous Money Wave Buy Signal was just too early…

Today’s Volume is low, probably flushing out all of the WEAK Hands, so Smart Money can Accumulate.  TRXC CHART


Related Post

– Green Line Weekly Dec 10, 2017

Subscribe to Our Newsletter

AGL Logo

Get our eBook Now!

Candlestick - A Swing Traders Friend

We don’t spam! Read our privacy policy for more info.

You’ve been successfully subscribed to our newsletter!

Voted #1 at Stock Charts

SH Chart
Inverse S&P 500 Fund (SH) will have a Money Wave Buy today.

Help Us Help Animals

Help Us Help Animals

Recent Comments

  • Market Breadth Indicators: A Trader’s Guide to Early Trend Detection on Backtesting: Definition and How a Trading Strategy Backtest Works
  • Island Reversal Pattern: Definition and Formation Explained on Double Top Pattern: How to Identify and Trade This Reversal Signal
  • Channel Pattern Guide: What It Is and Why It Matters on A Guide to Forecasting Using Moving Averages
  • What Is a Broadening Bottom Chart Pattern? Full Guide on Bull vs. Bear Market: An Investor’s Guide to Market Phases
  • ATGL Weekly Money Flow - 2025-05-11 on ATGL Top Pick of the Week! Apr 6, 2025

Become a Green Liner!

Help me make more Money in the Stock Market.

ON ATGL

  • DashBoard
  • Weekly Commentary
  • Daily Buy / Sell Signals
  • Day Trade Setup
  • Trading Rooms

Design & Develop By Pixelvect

STRATEGIES

  • Swing Trading
  • ATGL Pick of the Week
  • Dividend Growth
  • ETF Sector Rotation
  • Dogs of the Dow

HELP

  • ATGL Trading Rules
  • FAQ
  • Account Maintenance
  • Contact US
  • Join

FOLLOW US

Instagram Linkedin Twitter Facebook

© COPYRIGHT 2024 · ABOVETHEGREENLINE.COM · ALL RIGHTS RESERVED · PRIVACY · TERMS · CONTACT · WATCHLIST · CURRENT